In early August 2025, the cryptocurrency analyst community raises concerns about potential divergence signals on the Bitcoin (BTC) chart. These signals could reflect the sharp decline that occurred in 2021.
Divergence occurs when one indicator rises while another falls. This inverse relationship helps predict changes in market momentum. Below is a detailed explanation based on recent charts and data.
Bitcoin's Weekly RSI Divergence
The first warning signal comes from the Relative Strength Index (RSI) on the weekly timeframe. Analysts are worried because this signal is very similar to the setup seen in 2021.
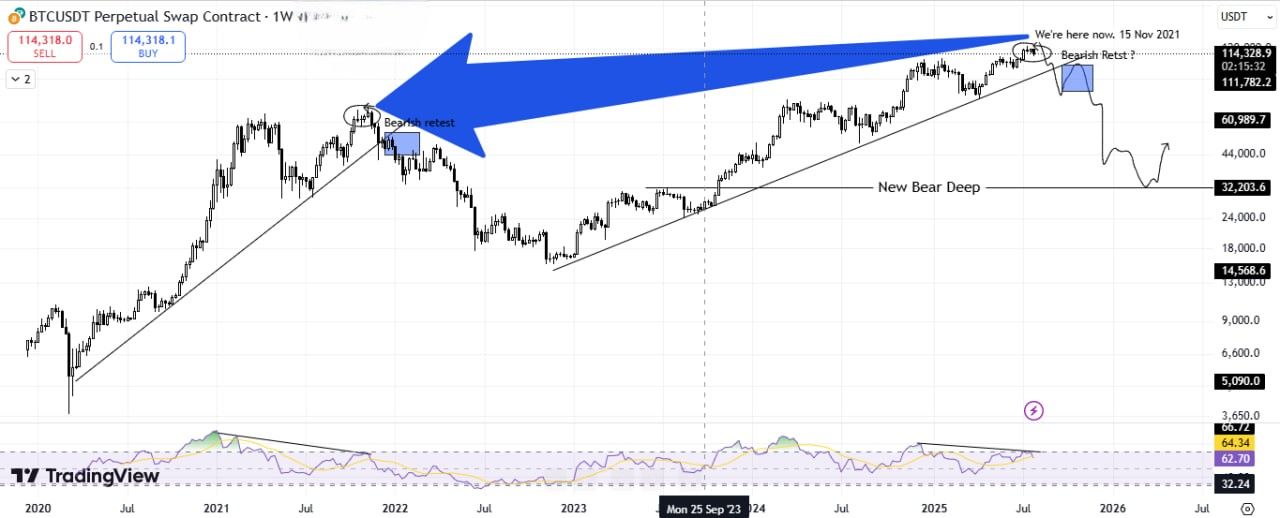
According to analyst Onur Barik, Bitcoin's current weekly chart structure is remarkably similar to the 2021 peak. Specifically, while Bitcoin forms a higher high, the RSI shows a lower high. This is a typical bearish divergence.
Based on this setup, Barik predicts a potential decline in Bitcoin.
"If it proceeds like 2021, a clear trendline break followed by a bearish retest could trigger a structural change." – Onur Barik, Analyst
However, from a fundamental perspective, CryptoQuant CEO Ki Young Ju recently shared a different view. He stated that the "Bitcoin cycle theory is dead," suggesting that comparisons with previous cycles may no longer be relevant.
Divergence Between DXY and Bitcoin
A recent BeInCrypto report mentioned that the US Dollar Index (DXY) reached a two-month high after the Fed decided to hold interest rates. Several analysts have also warned that the DXY could continue its upward trend in August. This could put downward pressure on Bitcoin.
These warnings gain more credibility as charts reveal a new divergence between DXY and Bitcoin.
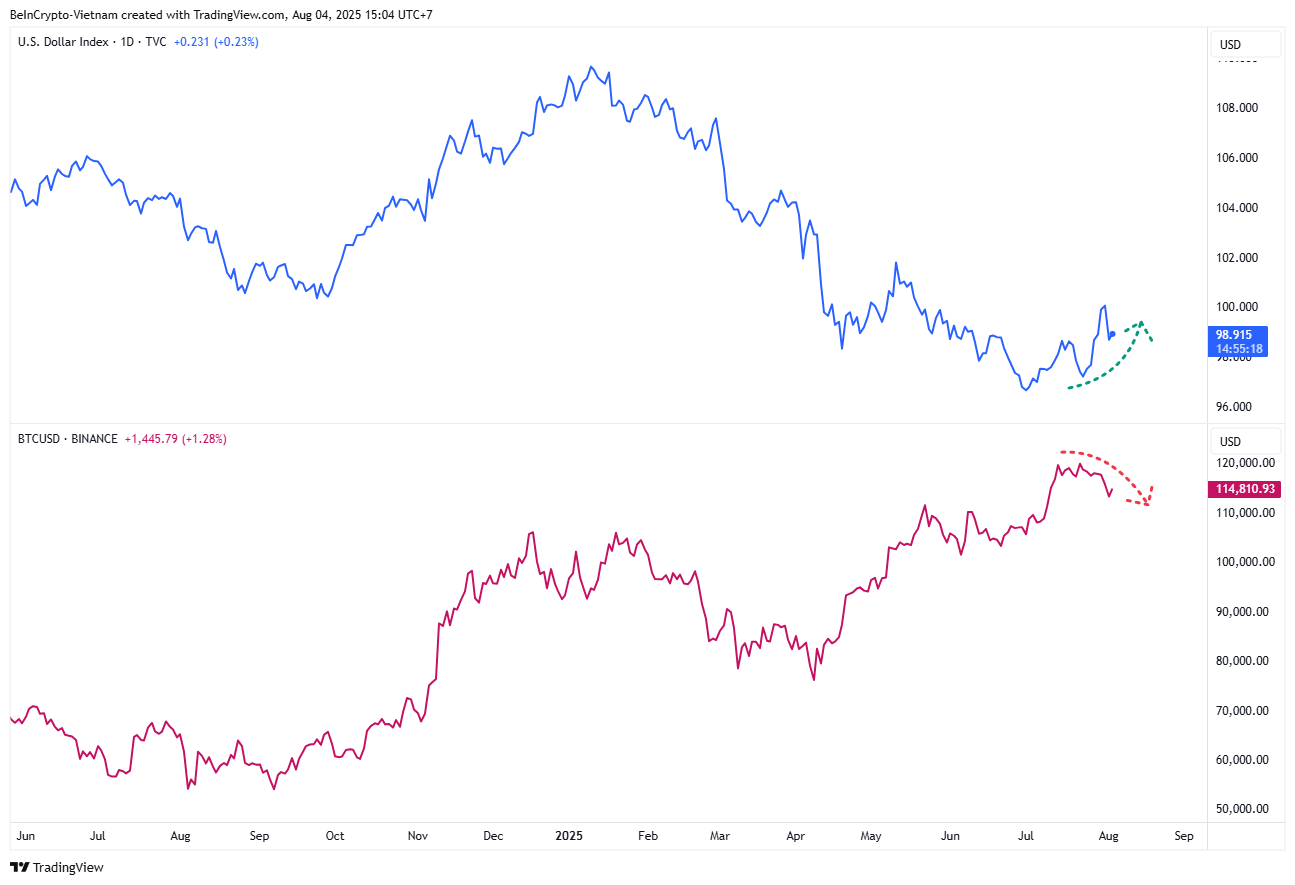
For instance, while DXY rose from 96.7 to 98.9 points, Bitcoin dropped from $120,000 to $114,000. Analyst John Kicklighter believes the DXY is forming an inverse head and shoulders pattern, a typical signal indicating a potential rally.
The $DXY inverse head and shoulders reversal we had at the beginning of the week is seeing a retest of the 'neckline' as former resistance, new support pic.twitter.com/A0jbvo3oJ4
— John Kicklighter (@JohnKicklighter) August 1, 2025
If this inverse correlation continues throughout August, Bitcoin could face further decline.
Divergence Between USDT Dominance and Bitcoin
USDT dominance (USDT.D) reflects the market capitalization of USDT as a percentage of the total cryptocurrency market. It typically has an inverse correlation with Bitcoin and altcoins.
According to TradingView data, USDT.D steadily declined from over 5% to 4.1% during the second quarter. After hovering in July, it rose again in August, reaching 4.4%.
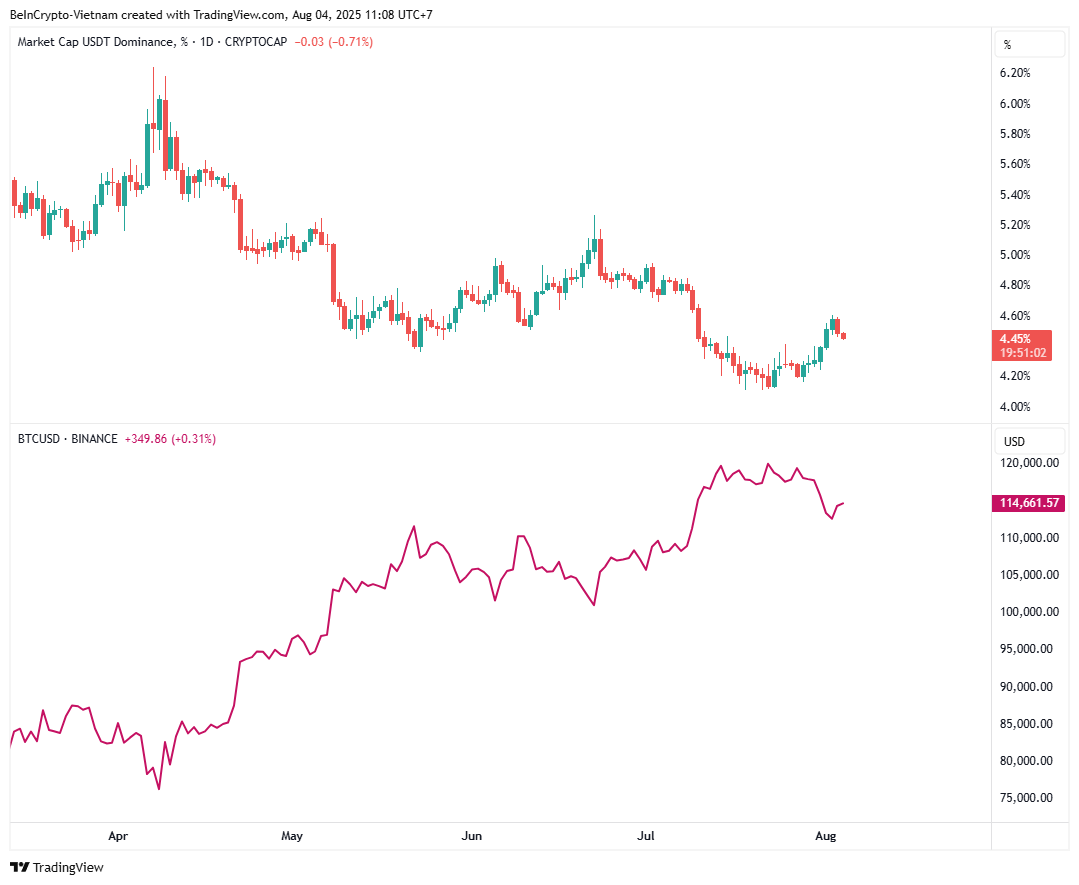
The rise in USDT.D suggests increasing risk-averse sentiment. Investors are converting cryptocurrency assets to stablecoins like USDT while waiting for better entry points. This indicates growing caution as the market becomes overheated.
If USDT.D continues to rise throughout August, this divergence could signal a Bitcoin correction.
Some analysts even predict that USDT.D could rise to 5% in August. However, not everyone views this negatively. Some believe it could provide valuable buying opportunities for altcoins.
"USDT dominance could go to 4.7%-4.8% in the coming weeks. This could drain liquidity from coins, leading to a sharp correction. But it will be a golden buying opportunity similar to April 2025." – Investor Niels
Historical data suggests that the third quarter typically shows Bitcoin's weakest performance. August is often cited as the worst month in the third quarter.
If confirmed, these divergence signals could make August 2025 a month to watch carefully. There could be risks as well as long-term opportunities.