Ethereum (ETH) price has dropped below $3,800 on its 10th anniversary. After briefly testing $3,900 earlier this week, it is cooling down. Traders worldwide are still focusing on the psychological $4,000 level. However, the latest on-chain data suggests that this rally may not be as strong as expected.
Despite a monthly rise of over 50%, the weekly increase is limited to 2%. Cracks are beginning to appear beneath the surface, which could create a bull trap that may make late entrants vulnerable.
Coinbase Premium Index Plummets
One of the most important signals comes from the Coinbase Premium Index. This index measures the price difference of Ethereum on Coinbase and other global exchanges.
Historically, when the index turns positive, it indicates strong buying activity from US-based institutions. However, the index has plummeted to -0.01, reaching its lowest level since May.
Token TA and Market Update: Want more such token insights? Subscribe to editor Harshi Notariya's daily crypto newsletter here.
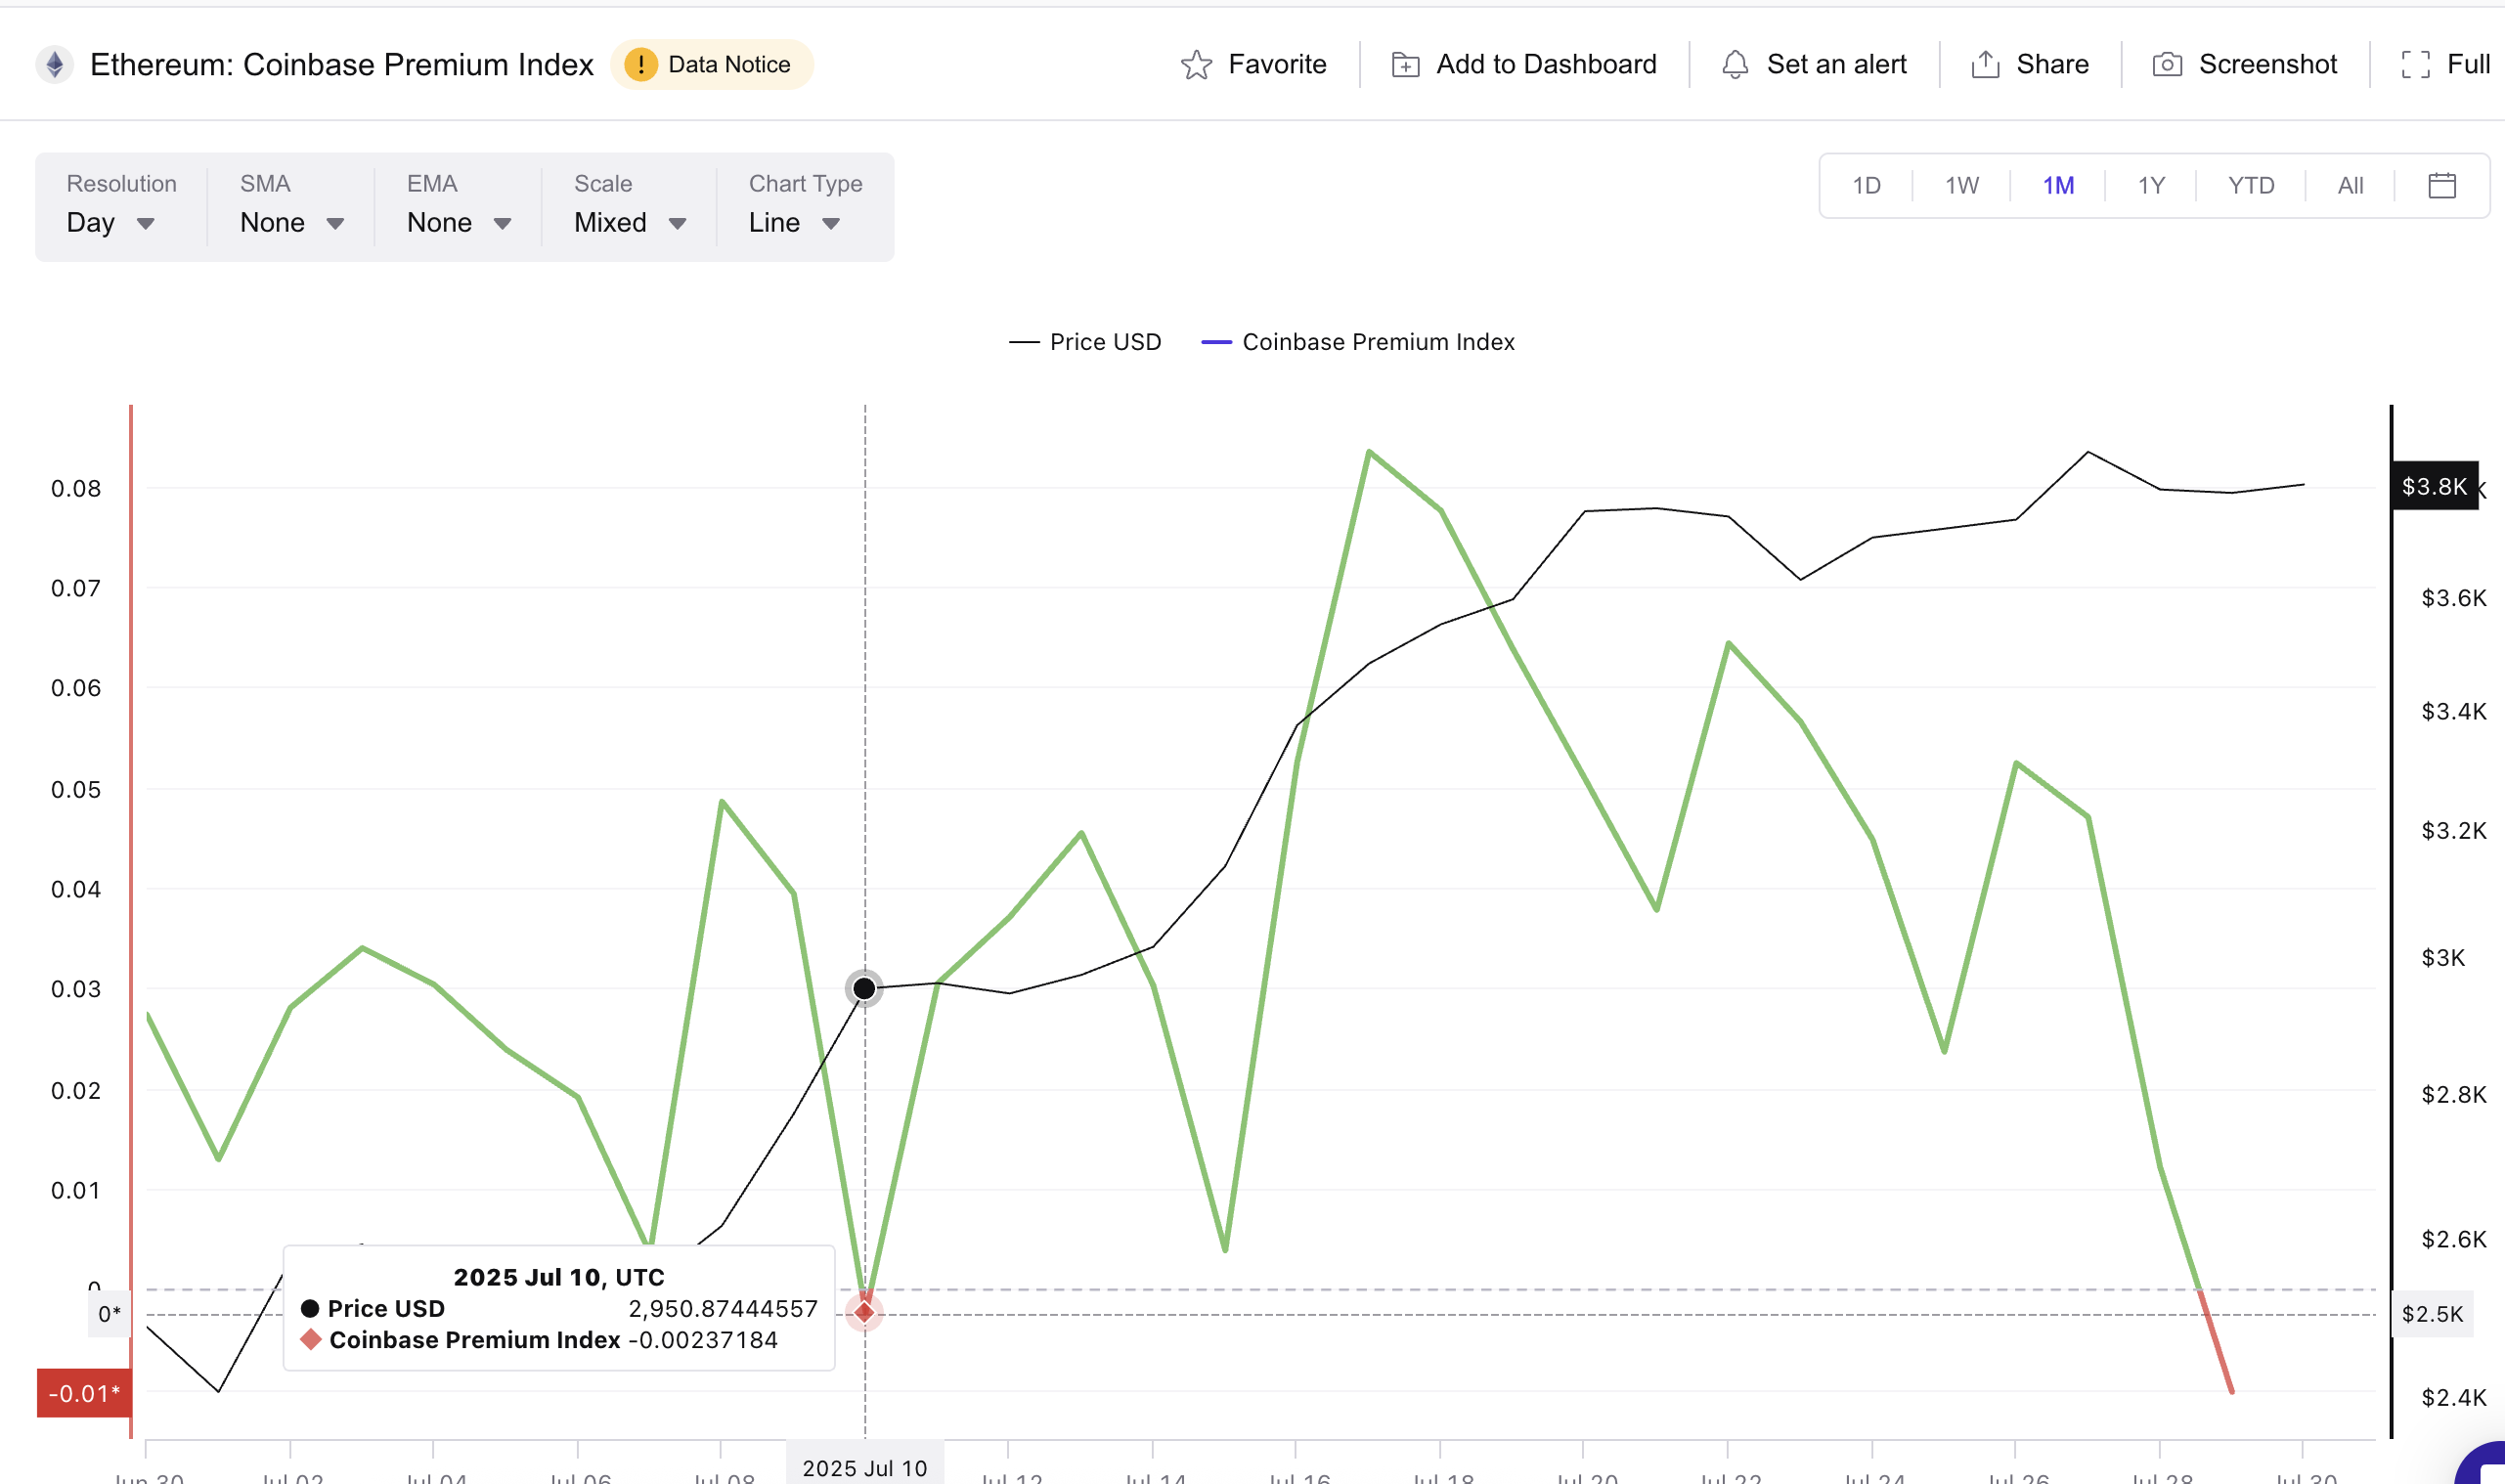
Notably, on July 10th, the index briefly turned negative at -0.0023, and ETH price barely reacted. This time, the decline is much deeper, suggesting US buyers are retreating despite July's ETF optimism.
The premium turning negative indicates a market situation that reveals a demand gap from US large traders. The absence of strong institutional bids could weaken the foundation of ETH's rise and increase the likelihood of the rally quickly losing momentum or reversing.
CMF and OBV, Contrasting Stories
The Chaikin Money Flow (CMF) adds another layer to this trap narrative. Over the past week, CMF has formed lower highs, showing declining fund flows despite the price forming higher highs.
Chaikin Money Flow tracks buying and selling pressure based on price and volume.
This difference often signals weakening buying pressure, with fewer dollars flowing into cryptocurrency even as the ETH price chart rises.
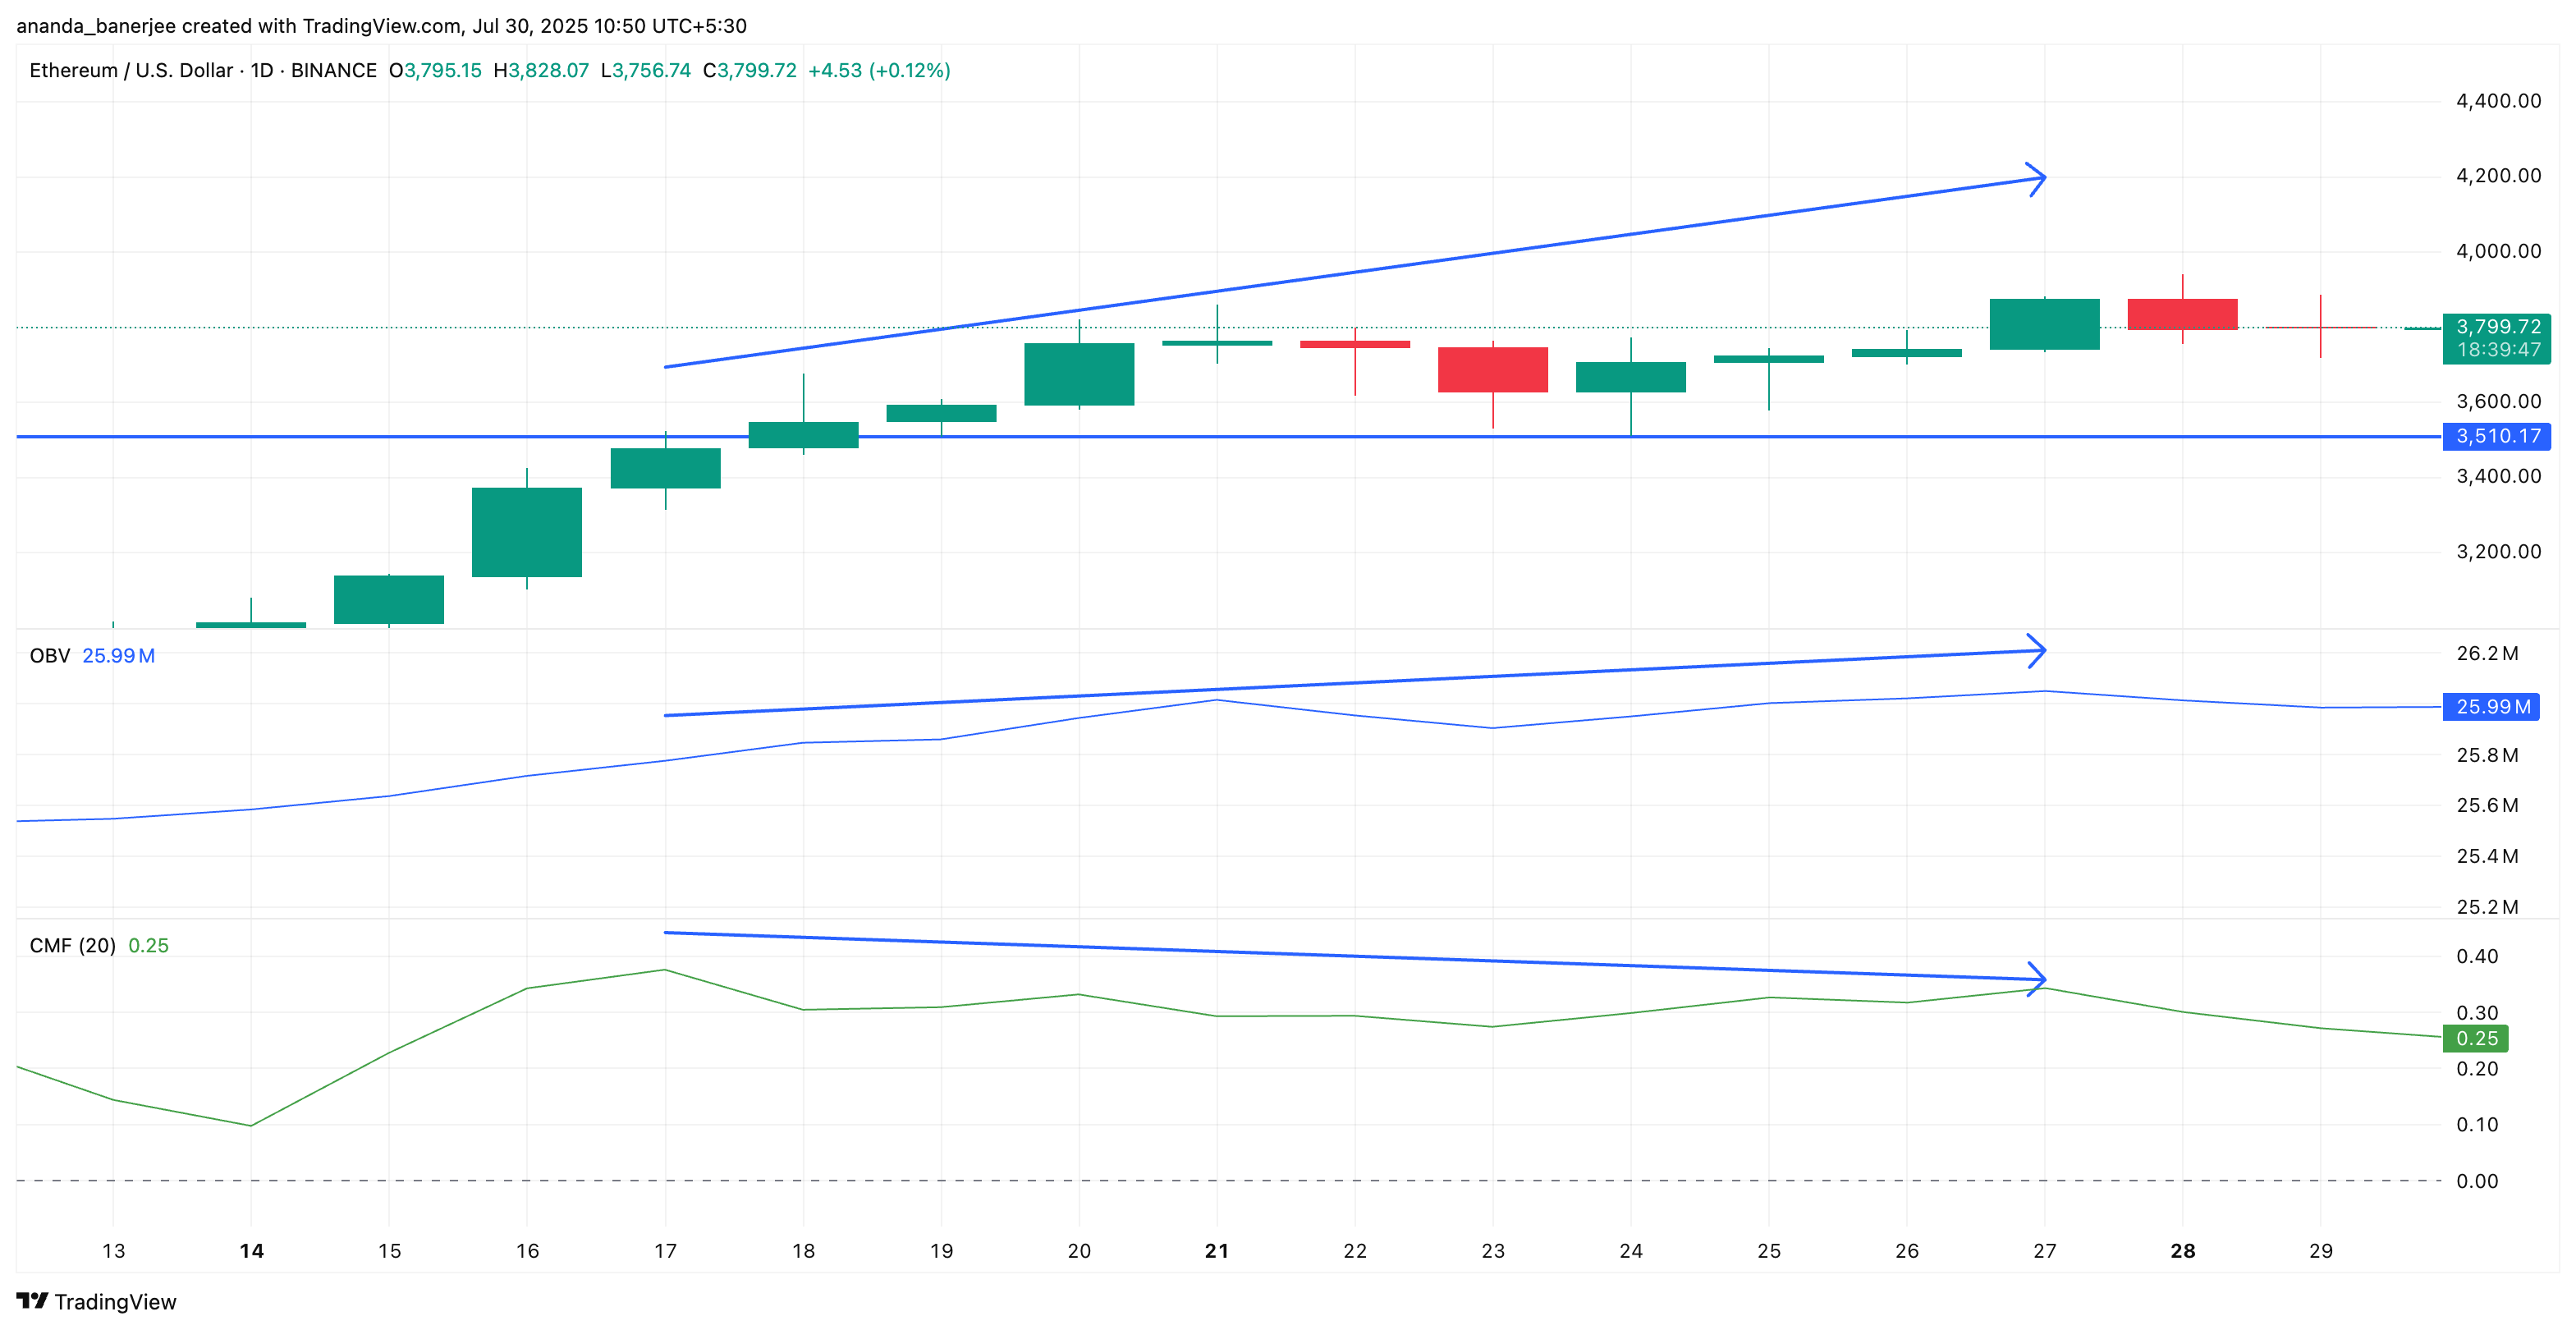
In contrast, the On-Balance Volume (OBV) is slightly rising along with the price trend. The OBV suggests steady participation but might mislead retail traders into thinking the momentum is stronger than it actually is.
OBV measures cumulative volume to show whether actual demand supports the movement.
The CMF's weak divergence suggests large players are retreating, leaving the market vulnerable to quick sentiment-driven reversals.
Viewing these two indicators together paints a picture of a rally losing internal conviction. This imbalance is exactly how a bull trap forms. The volume looks okay, but actual fund flows are decreasing.
Ethereum Price, Unstable Wedge Structure
Ethereum's price movement adds the final piece to this puzzle. The asset is rising within an ascending wedge pattern, which is considered a bearish signal indicating slowing upward momentum.
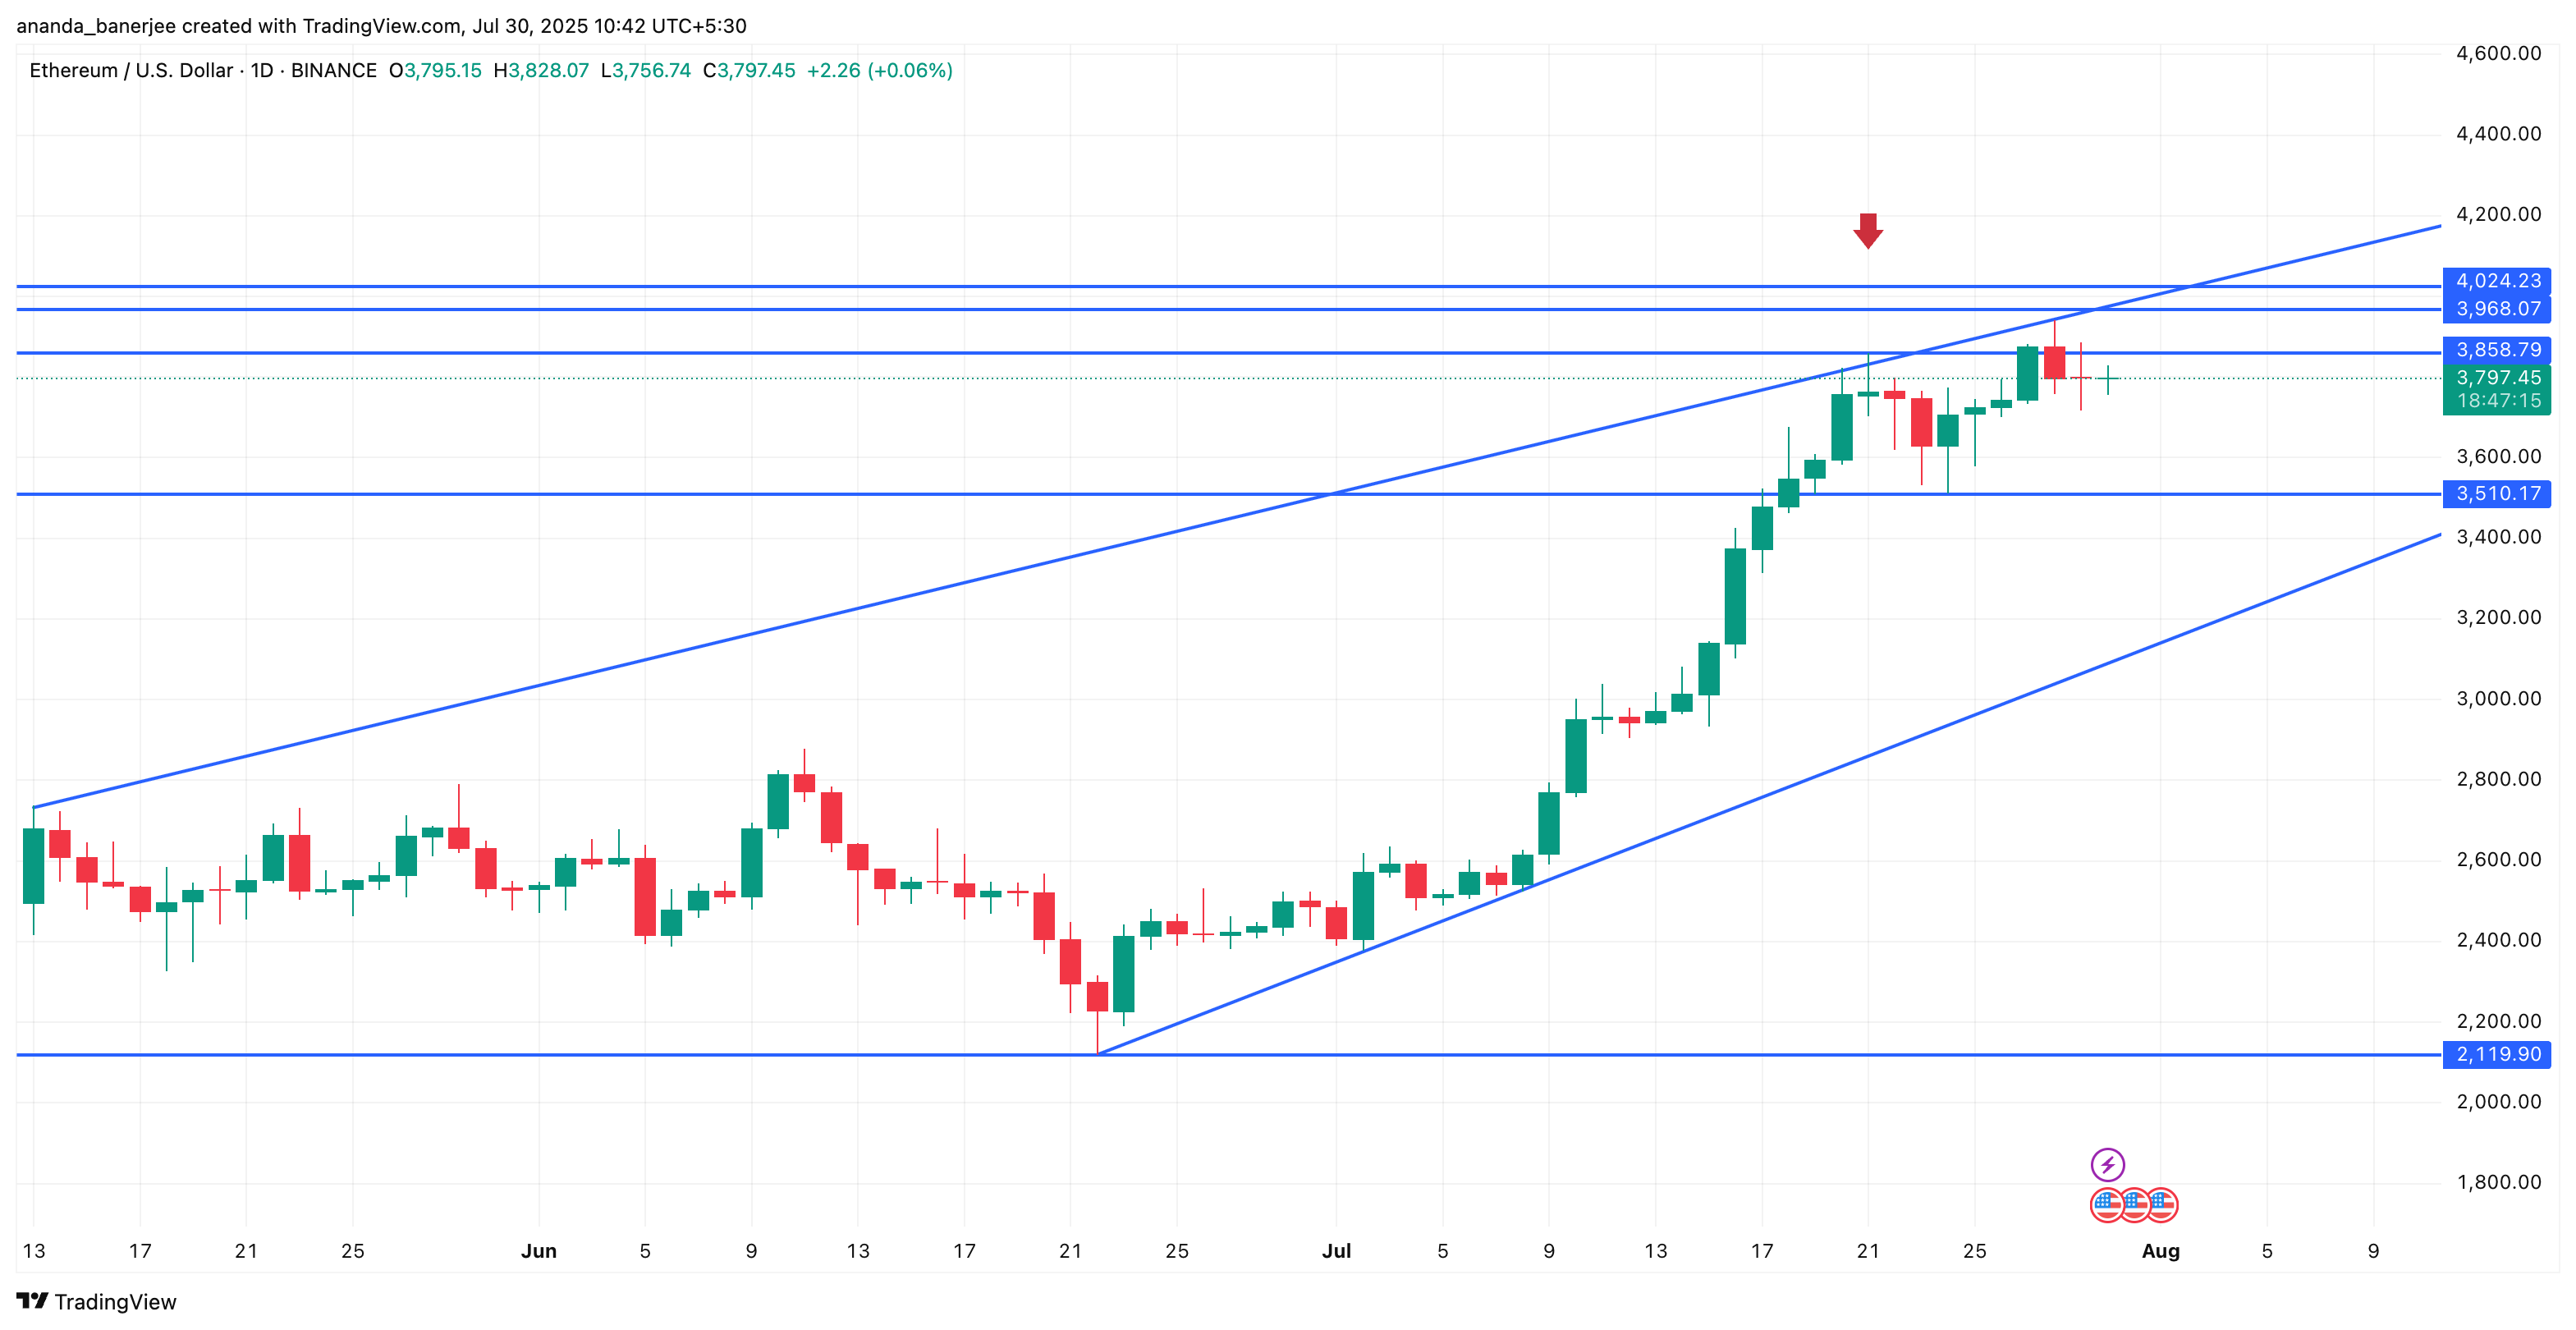
A few trading sessions ago, ETH price briefly broke above the wedge's upper trendline, reaching $3,858. This attracted breakout buyers but soon corrected below $3,510.
This false breakout is typical bull trap behavior, inducing the fear of missing out before potentially changing direction. As long as Ethereum's price remains within this wedge, the risk of another false breakout remains high.
To invalidate the bearish structure, Ethereum price must break and maintain above the psychological and technical resistance level of $4,024. Otherwise, ETH may retest the support line at $3,510.