In the last week of July, the total open interest in the cryptocurrency derivatives market remained at a historically high level, exceeding $20 billion. Current price fluctuations can cause significant losses for both long and short positions.
However, some altcoins are showing signs of massive liquidations this week. Let's take a closer look at which coins are experiencing this.
1. Ethereum (ETH)
Ethereum has been surrounded by positive news about institutional accumulation in recent months. Sometimes it even surpassed Bitcoin ETF inflows. Recently, Sharplink Gaming purchased 77,206 ETH for $296 million, increasing its total holdings to 438,000 ETH.
These positive developments pushed ETH close to $4,000 in the last week of July. Many analysts expect ETH to reach or exceed $4,000 soon. However, this level acts as a strong psychological resistance, which could trigger profit-taking at any time.
"The key resistance level for Ethereum $ETH is $3,980. Breaking through this could trigger a major upward rally!" cryptocurrency analyst Ali Martinez mentioned.
Regardless of direction, the liquidation map shows potential liquidations could reach billions of dollars if ETH moves significantly.
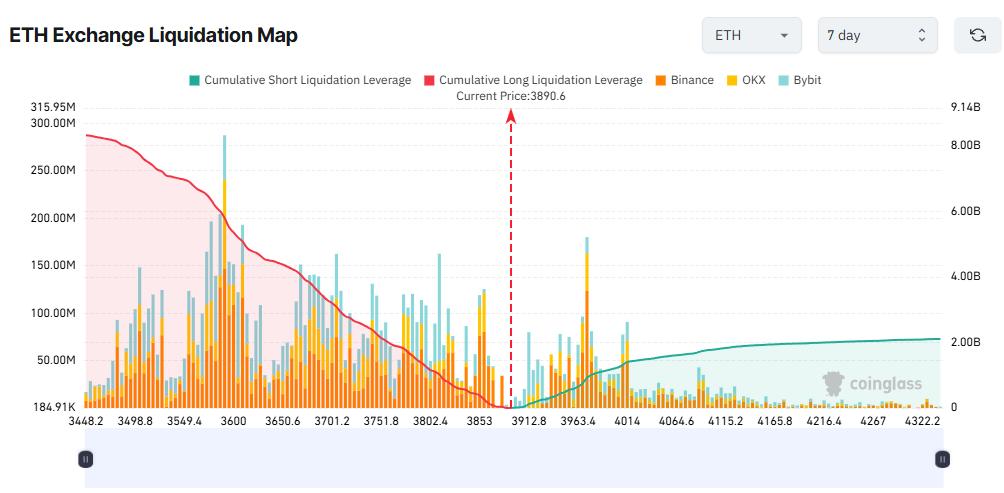
According to Coinglass data, if ETH breaks $4,000, total accumulated short liquidations could reach $1.2 billion. Conversely, if ETH experiences strong profit-taking and drops to $3,500, long liquidations could reach $7.8 billion.
The map reveals an imbalance between longs and shorts, indicating many traders are placing more money and leverage on a potential downward correction.
2. Solana (SOL)
While Solana still needs to rise over 50% to reach nearly $300 from the beginning of the year, open interest has already exceeded $11 billion. This is more than 25% higher than when SOL peaked in January.
This suggests traders are more exposed to Solana. However, most exposure comes from derivatives rather than spot trading.
According to CoinMarketCap data, SOL's current daily spot trading volume is just over $6 billion. This is significantly lower than the tens of billions it saw in January.
This significant difference between derivatives and spot trading volumes reflects Solana traders' focus on short-term bets. Consequently, this token is vulnerable to sharp fluctuations and potential liquidations.
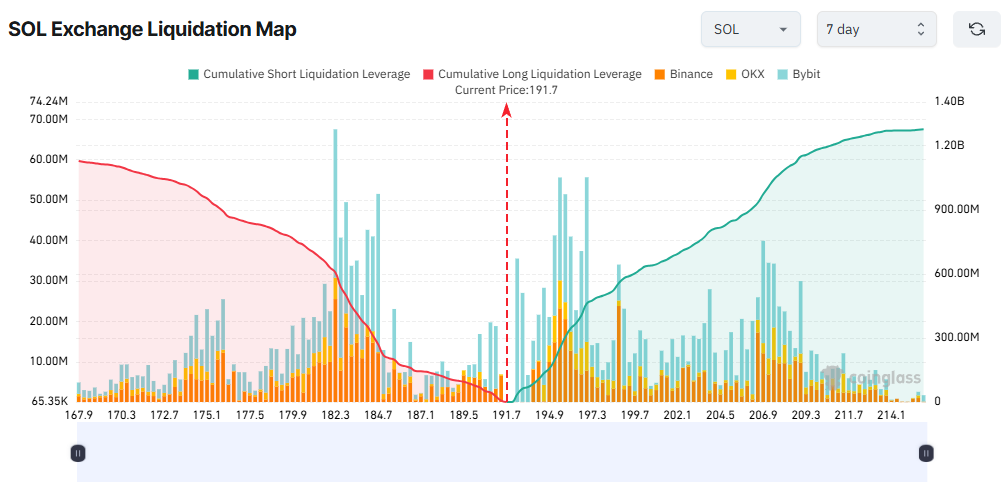
The liquidation map shows a balance between long and short positions. SOL is trading near $191, and if it exceeds $200, over $600 million in liquidations could occur. Conversely, if it drops to $181, over $700 million in long positions could be liquidated.
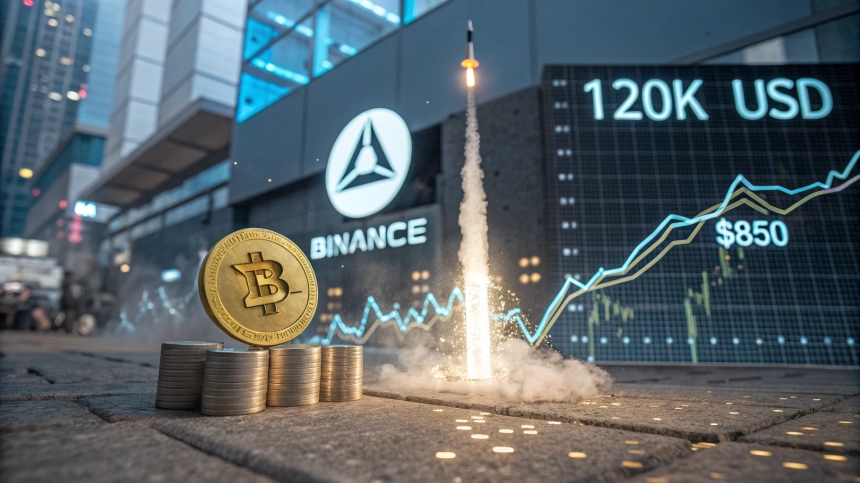
3. BNB
In the last week of July, BNB reached a new all-time high of $859. This rally was triggered by increased activity on the BNB Chain and growing corporate interest in BNB finances.
While BNB hasn't shown signs of retreat, Binance's BNB/USDT liquidation map shows high leverage up to 50x.
The map is almost entirely covered in yellow (indicating 50x leverage), concentrated especially in the range between $753 and $875.
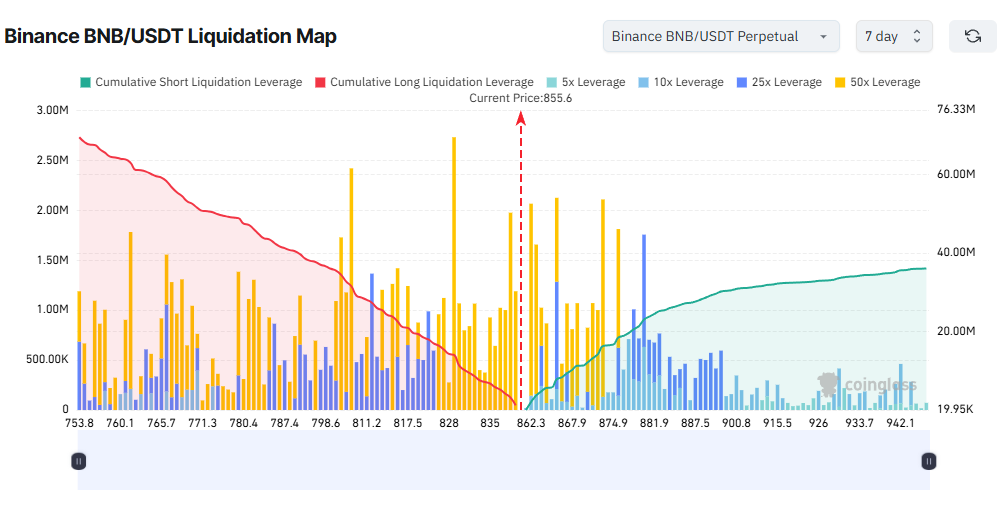
On Binance, long liquidations are more numerous than shorts. If BNB exceeds $875, $18.5 million in short positions could be liquidated. Meanwhile, if BNB falls below the psychological $800 level, over $36 million in long positions would be eliminated.
Ignoring short-term fluctuations, many analysts believe BNB could reach $1,000 soon. However, some offer more nuanced views, suggesting it might first drop below $800 before resuming its upward trend.