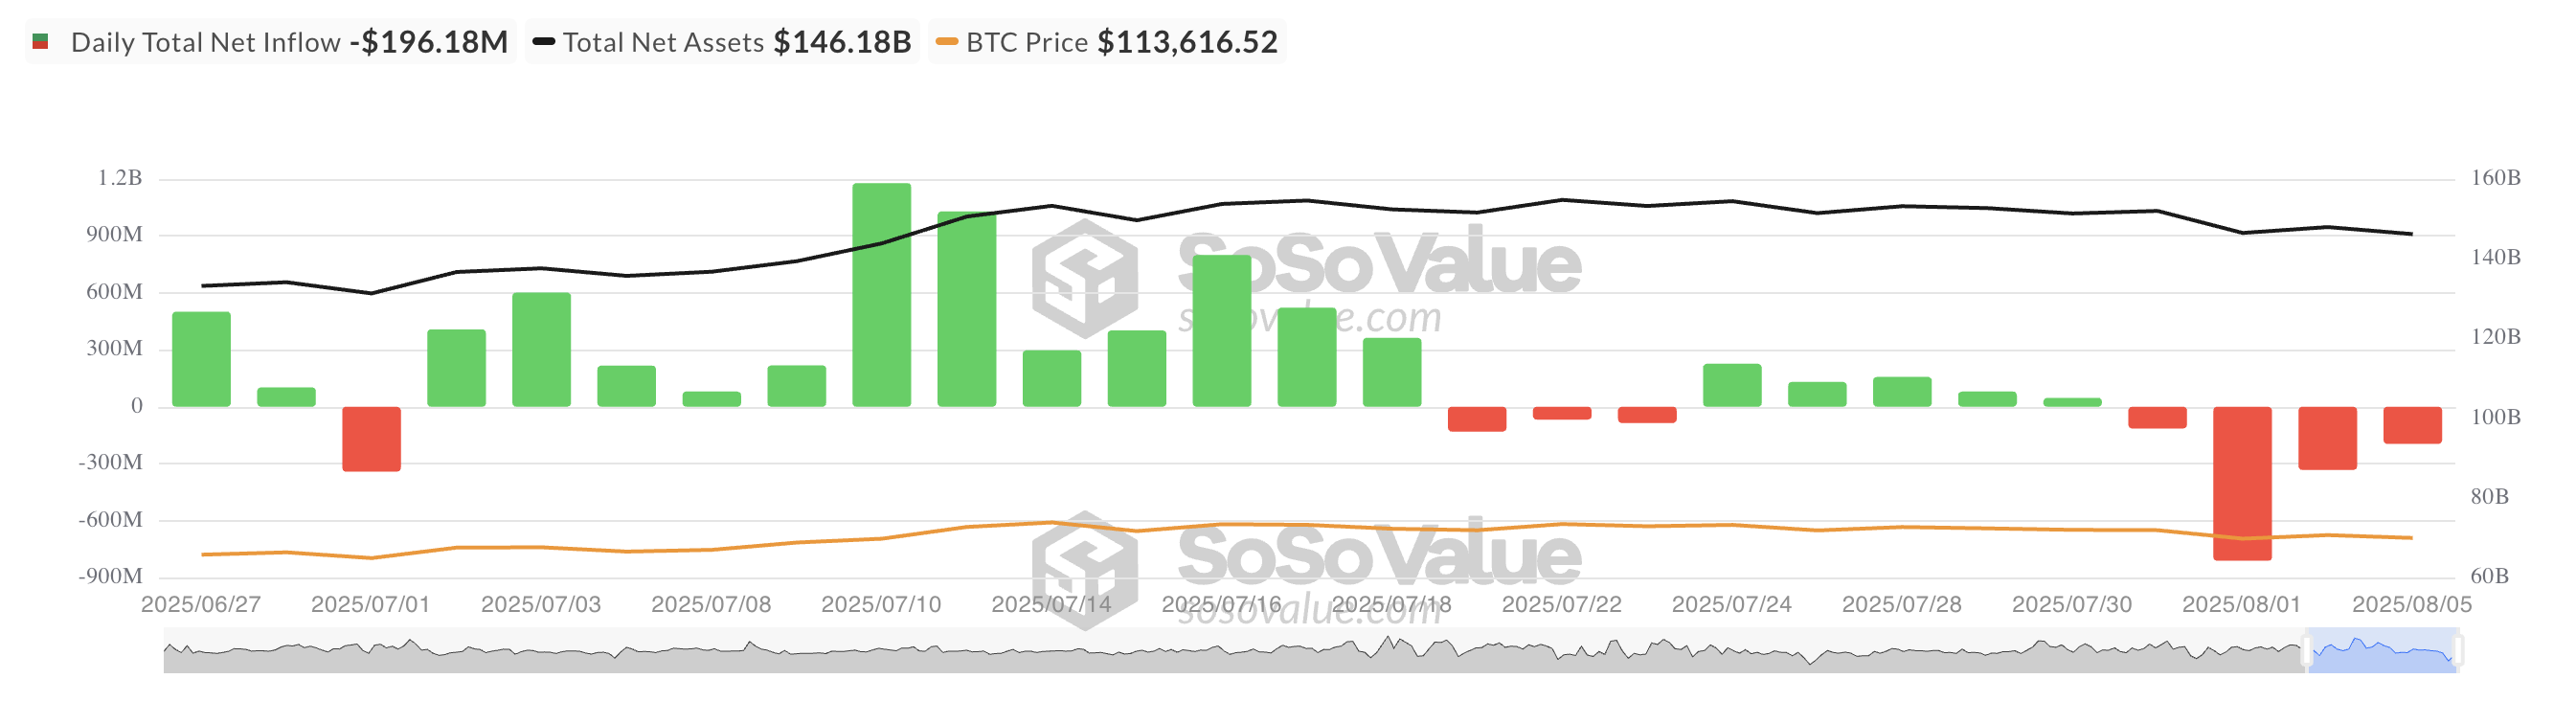
On Tuesday, the Bitcoin spot ETF recorded its fourth consecutive net outflow, setting the longest withdrawal streak since April.
This continuous capital outflow reflects a decline in market sentiment, which could potentially lower the Bit price in the short term.
Bitcoin ETF Outflow Exceeds $1 Billion in 4 Days… Institutional Investors Retreat
The 4-day ETF sell-off indicates that institutional investors' confidence has weakened. They now aim to reduce their Bit exposure. According to Soso Value, the net outflow from this fund over the past 4 days has exceeded $1 billion.
Token Technical Analysis and Market Update: Would you like more such token insights? Subscribe to editor Harshi Notariya's daily crypto newsletter here.
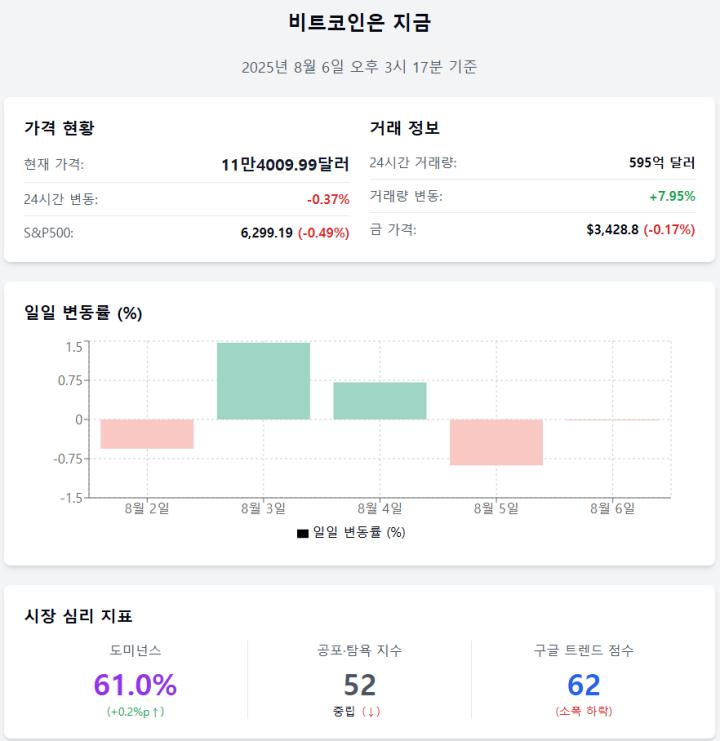
This is a significant development. The recent rally to Bit's all-time high of around $122,054 was primarily triggered by the activity of the same investors.
In July alone, spot Bit ETFs brought in over $6 billion in capital, helping drive price increases. Their retreat suggests a lack of institutional support, which could significantly impact cryptocurrency values in the short term.
Moreover, on-chain data emphasizes a potential trend reversal. This is reflected in the coin's long/short ratio, currently positioned at 0.93.
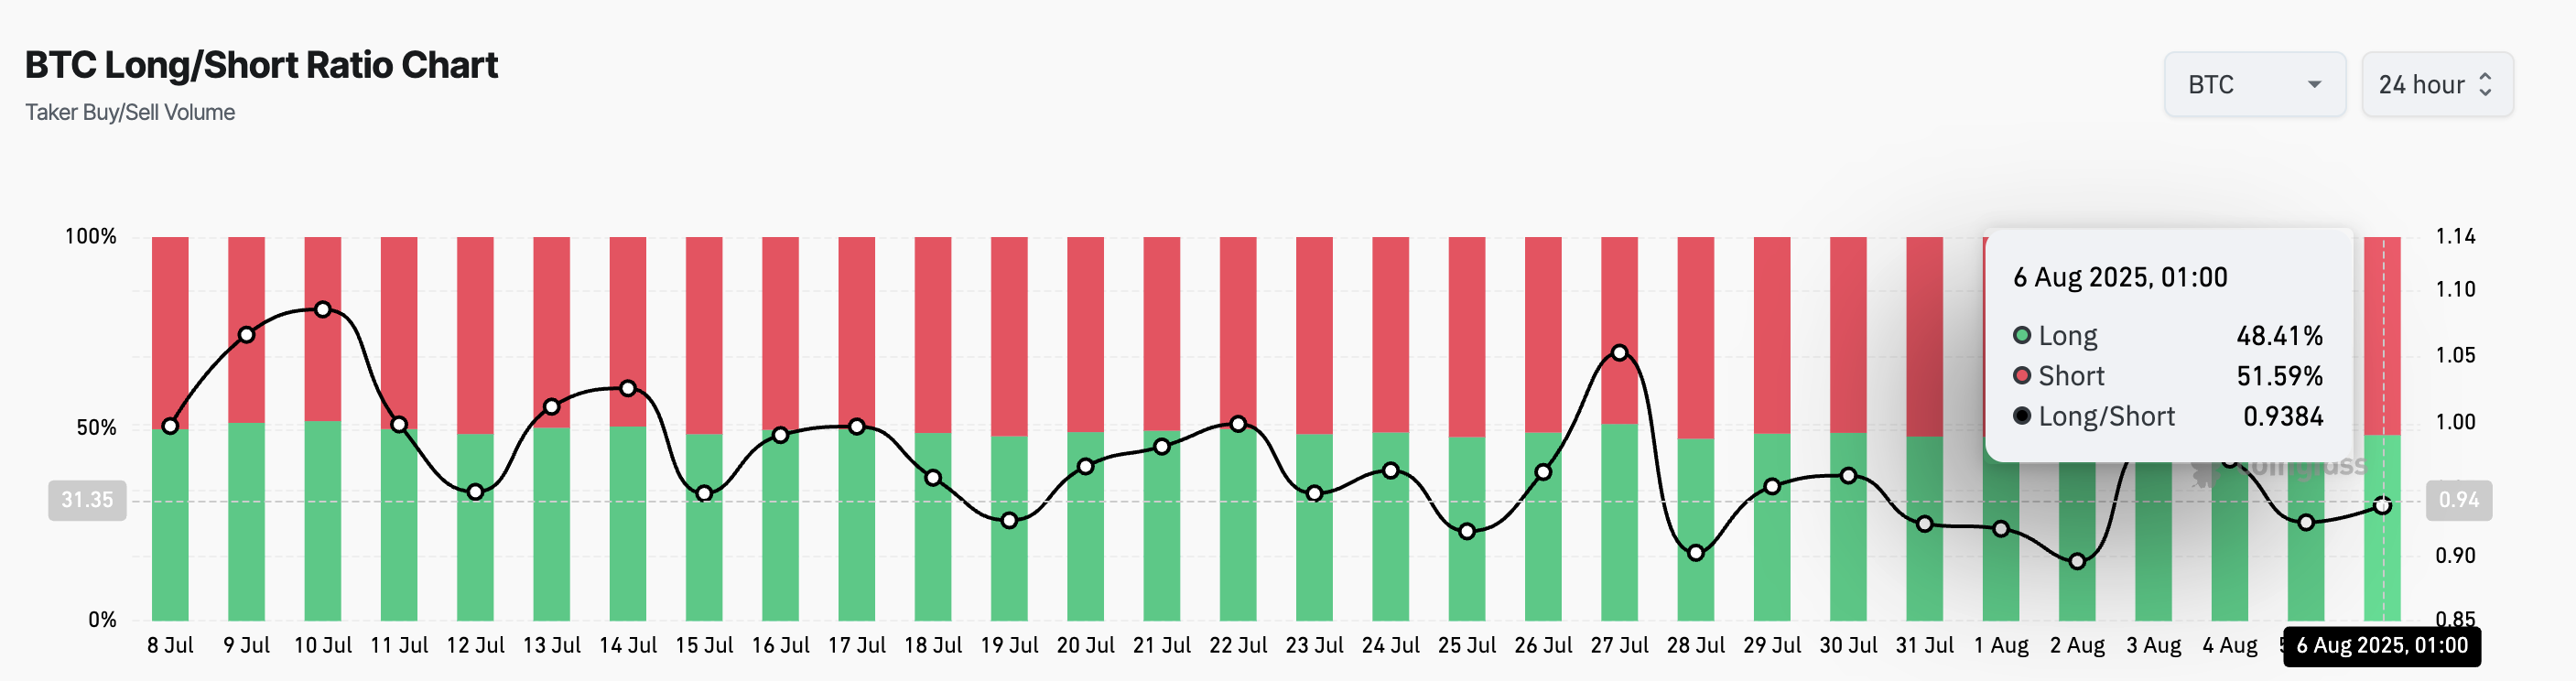
The long/short indicator measures the ratio of long and short positions in the asset's futures market. A ratio above 1 indicates more long positions, meaning most traders expect the asset's value to rise.
Conversely, like major coins, a long/short ratio below 1 suggests more traders anticipate the asset's price will fall.
BTC Downtrend, Target $111,000
The daily chart readings show the Bit price is positioned below the Parabolic Stop and Reverse (SAR) indicator. Currently, the points forming this indicator create a dynamic resistance at $118,086 above the Bit price.
The asset's Parabolic SAR indicator tracks potential trend direction and reversals. When points are below the asset's price, the market is experiencing upward momentum, and continued buying activity can drive its value higher.
Conversely, when points are above the asset's price, it signals increased selling pressure and a potential downtrend. If this continues, the Bit price could drop to $111,855.
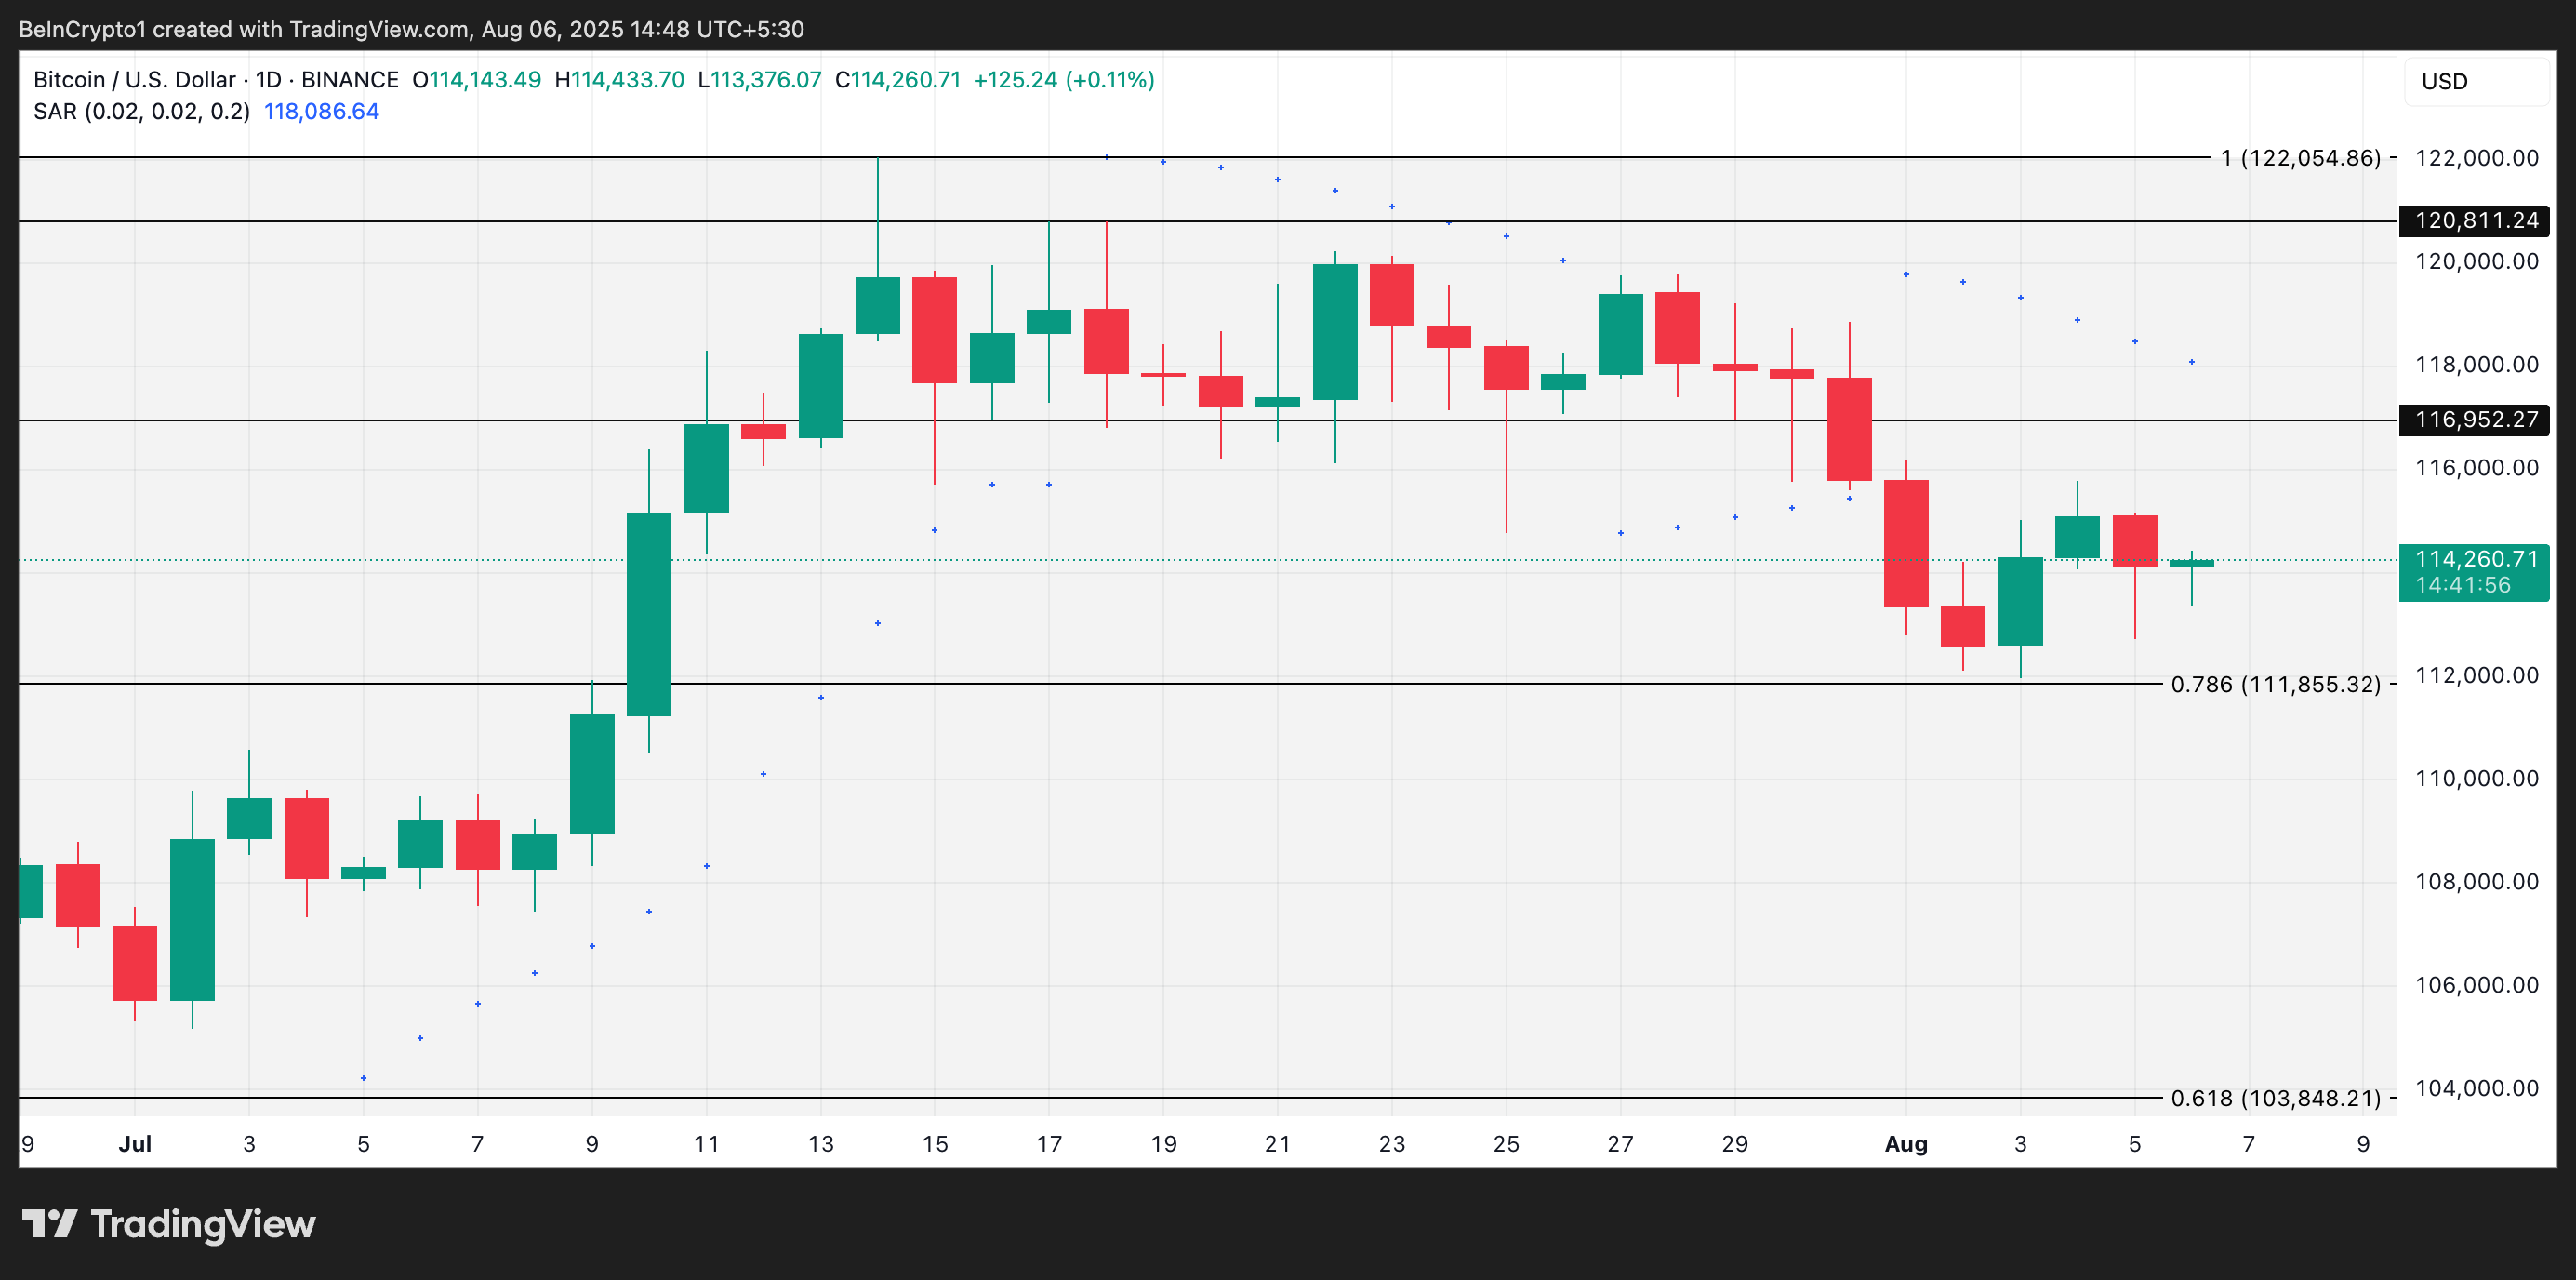
However, if new demand enters the market, this could push the major coin to $116,952.