Source: Crypto Big Coconut
Original Title: Bitcoin Approaching 150,000? Analyzing the 9.6 Billion USD Whale Selling Pressure
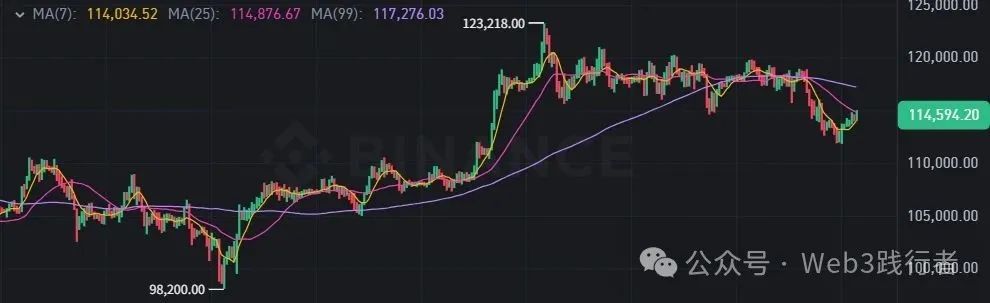
The Bitcoin market is experiencing a textbook-like long and short game. After touching the historical peak of $123,250, BTC has undergone a 7.50% callback within three weeks, temporarily diving to the critical level of $113,000.
However, seasoned analysts, looking beyond short-term fluctuations, have captured a more essential market trend - the powerful support of the 50-day Exponential Moving Average (EMA), which perfectly resonates with the neckline of the inverse head and shoulders pattern, constructing a "perfect bottom" structure from a technical perspective.
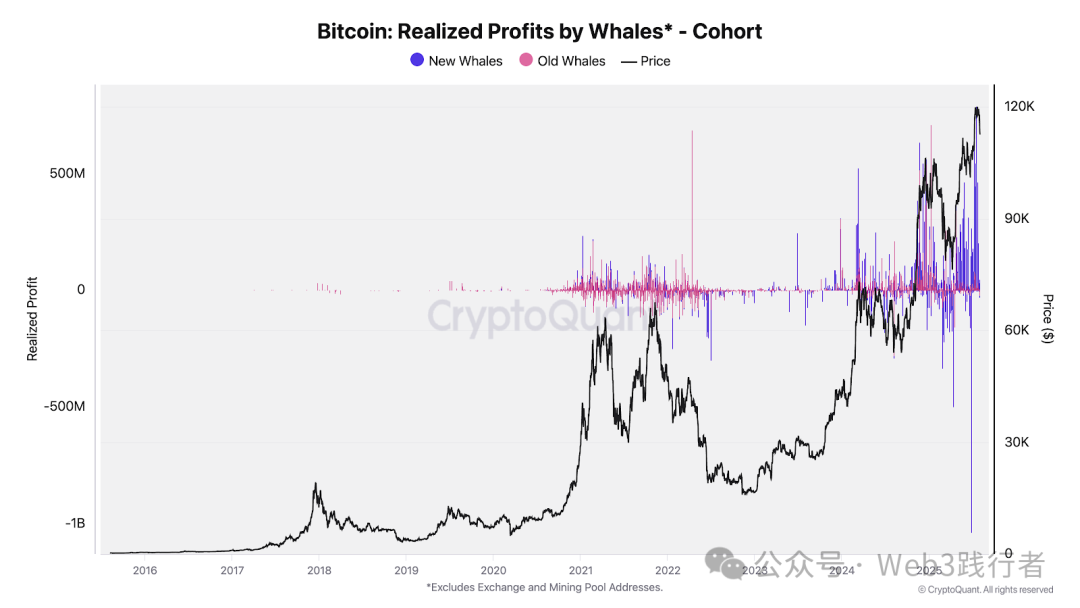
Notably, the fund flow presented by on-chain data is even more valuable for interpretation. The recent 9.6 billion USD "whale" selling behavior is not actually a traditional bearish signal. Looking back historically, this scale of profit-taking remarkably echoes the market performance after the spot ETF approval in March 2024 and Trump's potential victory at the end of 2024.
After these historic selling events, the market has always initiated a stronger upward trend after a brief consolidation, highlighting the continued operational logic of institutional funds "positioning during adjustments".
Double Support Establishing Bull Market Launch Point
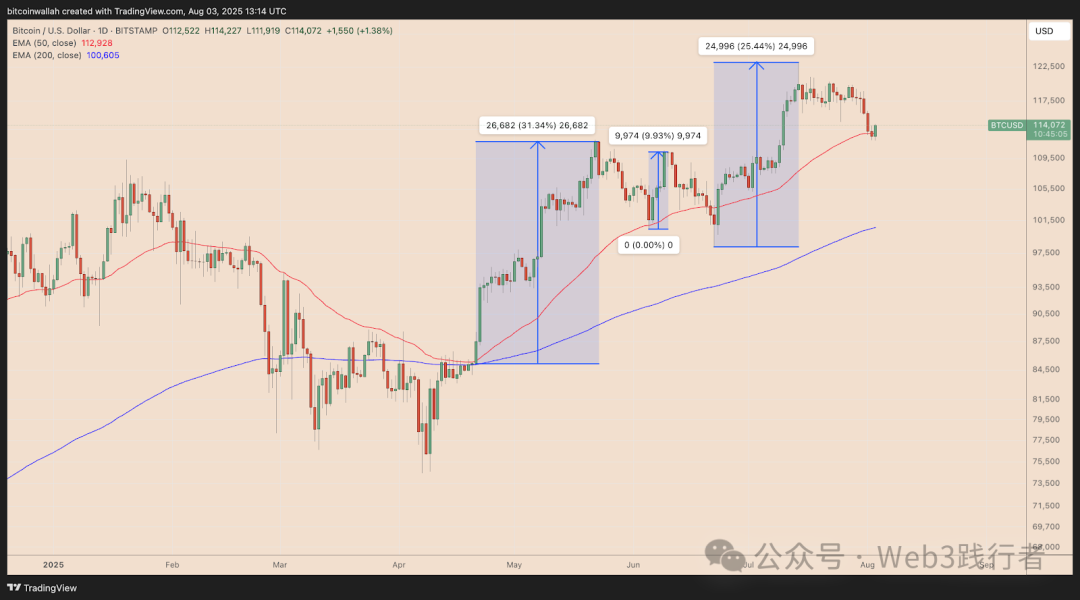
In Bitcoin's daily cycle chart, the current price trend is clearly presenting a typical bull market correction trajectory. As of August 3rd (Sunday), the price briefly broke below the critical 50-day EMA (marked in red on the chart) and quickly recovered, perfectly replicating the June market logic - where the price similarly triggered a 25% strong rebound after breaking through this moving average.
More critically, the 50-day EMA has formed a strong technical resonance with the Inverse Head and Shoulders (IH&S) neckline. Reviewing the breakthrough trend at the end of July, after successfully standing above this neckline, the current callback can be seen as a secondary confirmation process of the breakthrough's validity. If this key support area is firmly maintained, the technical side will officially open the space for measuring price increase, with an upward target directly pointing to $148,250. This core target strategically echoes the multiple cycle predictions - where the round bottom pattern's measurement target is $140,000, and the bull market flag pattern's extended target points to $150,000, further strengthening the medium-term upward logic through multiple dimensional convergence.
The market structure has quietly transformed: the gap near $115,000 in the CME market has been precisely replenished, high-leverage speculative positions have been effectively cleared, and financing rates have returned to a healthy neutral zone. This series of structural adjustments has cleared potential obstacles for the market to escape the oscillating pattern and enter a "net multi-driven upward" phase, laying a more solid foundation for upward movement.
Bull Market Cycle Cooling Mechanism Under 9.6 Billion USD Selling Pressure
March 2024: After the US spot Bitcoin ETF approval, accompanied by 8.5 billion USD net inflow, triggering the first whale profit-taking sell-off;
November 2024: The Trump victory event driving Bitcoin price to break through the $100,000 integer mark, triggering the second systematic reduction during high market sentiment;
July 2025: After achieving the historical breakthrough of $120,000, early position "whales" transferred 80,000 Bitcoins in a single instance (equivalent to about 9.6 billion USD at the time), constituting the third concentrated selling pressure.
These landmark "whale fund descent" events correspond to 2-4 month market consolidation cycles, becoming an internal cooling mechanism for releasing profit pressure and adjusting the bull market pace, reflecting large funds' active management strategy of market cycles.
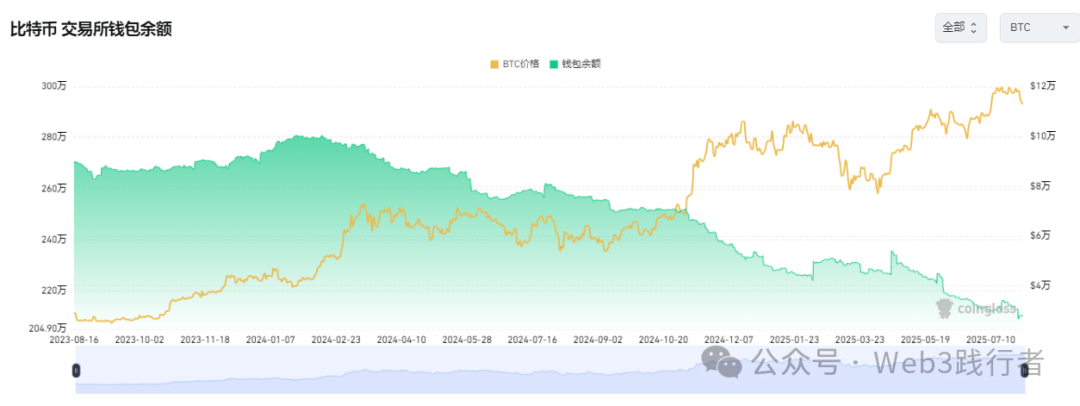
However, current on-chain data shows that whale group strategic hoarding continues to deepen. Addresses holding 10 to 10,000 Bitcoins have net accumulated 83,105 Bitcoins in the past 30 days; simultaneously, exchange total balance has dropped to 2.44 million coins, the lowest in six years.
Liquidity Dividend Window Under Interest Rate Reduction Cycle
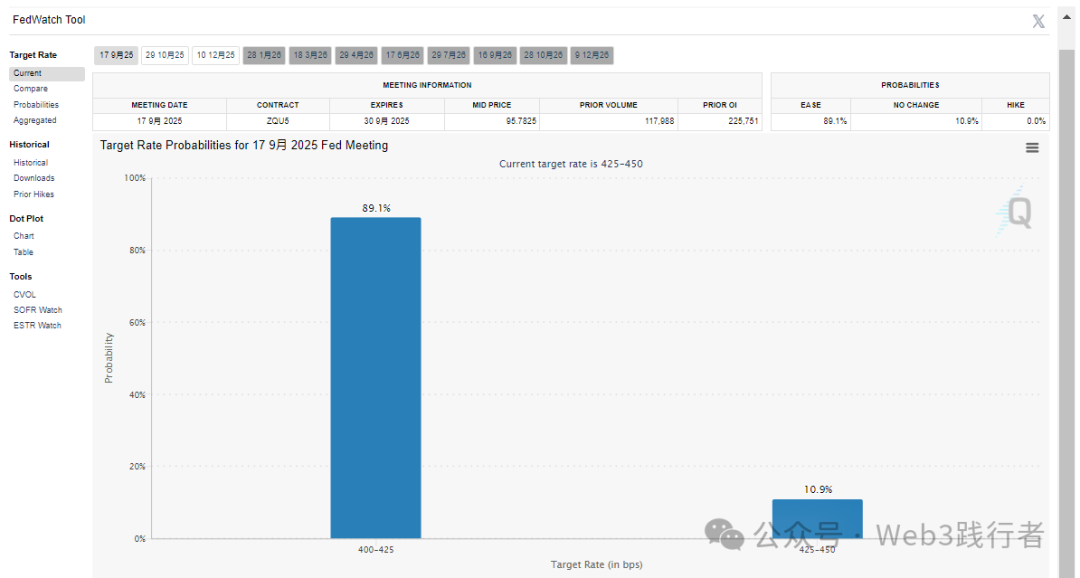
Bitcoin's upward logic is deeply coupling with the global monetary policy cycle. The US July non-farm data unexpectedly weakened - with only 73,000 new jobs added and unemployment rate simultaneously rising to 4.2% - this key macro signal completely reshaped market expectations, pushing the probability of the Federal Reserve starting rate cuts in September to 80%. This expectation shift precisely confirms the previous Snowball column's forward-looking judgment: under the combined effect of 31 trillion USD bond issuance pressure and interest rate reduction cycle, Bitcoin's anti-inflation and asset revaluation properties will be further highlighted, becoming a core beneficiary asset class under the "fiscal-led" macro paradigm.
The current crypto market's capital inflow pattern is undergoing a profound structural transformation:
ETF track continues to lead in attracting funds: Spot Bitcoin ETF market maintains strong capital magnetic effect, with net inflow reaching 29 billion USD in the past two weeks. Industry leader BlackRock's product holdings have broken through 700,000 Bitcoins, with management fee income already crushing S&P 500 ETF, demonstrating institutional funds' allocation preference for core crypto assets.
Traditional enterprises accelerate monetary asset layout: Real economy enterprises' crypto asset reserve strategies continue to deepen, with a Mexican hotel giant investing 500 million USD to increase Bitcoin holdings, and Japan's Metaplanet company's holdings breaking through 2,200 coins. More notably, traditional manufacturing sectors like medical and chip industries are beginning to follow, marking crypto assets' transition from speculative targets to strategic reserve assets.
Ethereum ETF achieves breakthrough: Ethereum spot ETF has created a record of 10 consecutive weeks of zero capital outflow, attracting 3.5 billion USD in a single month. Its stable staking annual yield (around 4%) gradually gives it "digital bond" asset characteristics, becoming a new choice for low-risk preference institutional funds, significantly enhancing Ethereum ecosystem capital depth.
Historical Cycle and Technical Pattern Resonance Verification
Multiple technical analysis models and cycle rules consistently point to the core target range of 140,000 - 150,000 USD, forming a multi-dimensional verification system:
Round Bottom Pattern Measurement Derivation: After breaking through the 106,660 USD neckline at the daily level, according to classic pattern measurement rules, the upward target calculation is $140,000, representing a theoretical increase of 37% from the current price;
VIX Volatility Correlation Model: When the S&P 500 Volatility Index (VIX) is below 18 in a "low risk appetite" environment, Bitcoin network economist Timothy Peterson's quantitative model shows a future 100-day price target of $135,000, with a historical prediction accuracy of up to 95%;
Halving Cycle Spatio-temporal Rule: After the fourth block reward halving event in May 2024, reviewing historical data reveals that bull market peaks usually occur 12-18 months after halving, making October 2025 a key time window for this cycle.
The underlying logic supporting these targets lies in Bitcoin's profound "asset repricing" process: its attributes have completely transformed from a marginal speculative asset to a strategic allocation tool for corporate balance sheets. When MicroStrategy's holdings break through 190,000 coins and BlackRock incorporates it into its trillion-dollar asset management portfolio, Bitcoin's market liquidity has surpassed gold, gradually establishing a new positioning as a "corporate reserve asset standard".
Market sentiment and capital movements show significant differentiation: while mainstream media maintains a wait-and-see attitude and retail investors experience panic due to non-farm data, institutional sophisticated funds are taking the opportunity to complete their layout. From precise gap replenishment in the CME market to whale holdings turnover, from continuous warming of Federal Reserve rate cut expectations to the spread of corporate Bitcoin hoarding, technical signals and fundamental logic have formed a powerful upward resonance. If historical cycle patterns continue, the current consolidation phase may become the last round of chip washing before Bitcoin breaks through $150,000.
Twitter:https://twitter.com/BitpushNewsCN
BitPush TG Community:https://t.me/BitPushCommunity
BitPush TG Subscription: https://t.me/bitpush