I. Weekly Market Review: (07.28~08.03)
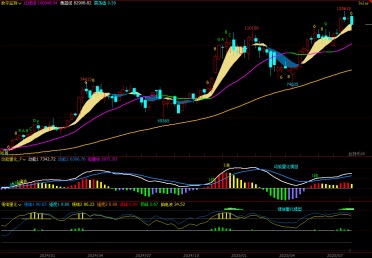
The opening price this week was 119,415.56 points, with the highest price of 119,800.00 points on Tuesday, the lowest price of 111,920.00 points on Tuesday, and the final closing price of 114,208.80 points. The weekly decline was 4.55%, with a maximum amplitude of 6.59%, and a trading amount of $12.233 billion. A large green candle was formed this week, with the stock price closing below the 5-week moving average.
Bitcoin Weekly K-line Chart: (Momentum Quantitative Model + Sentiment Quantitative Model)

Figure One
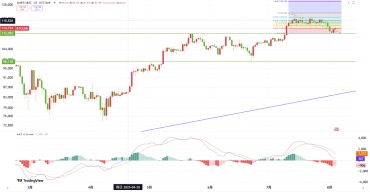
Bitcoin Daily K-line Chart:

Figure Two
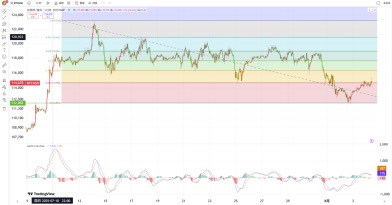
Bitcoin Hourly K-line Chart:

Figure Three
In the previous weekly review, the author emphasized that 123,218 points had become the recent high point of the index; after forming a daily-level momentum top divergence, the operating strategy shifted from an aggressive long mindset to a defensive mindset; reminding investors that the market is gradually transitioning from high-level oscillation to downward adjustment, and to pay attention to the magnitude of the decline. The predicted first resistance level for the index rebound is around 120,250 points, and the second resistance level is around 121,200 points; during the downward adjustment, the first support level is around 114,200 points, with a strong support zone between 111,980 and 110,530 points, focusing on the support strength in this area.
Reviewing the actual trend this week shows that after opening slightly higher on Monday, the index reached the week's highest point of 119,800 points before oscillating downward, closing with a 1.14% decline green candle; the next two days formed two doji green candles, with increasingly longer upper and lower shadows and lower lows, gradually increasing oscillation amplitude; from Thursday to Saturday, three green candles were formed, with a decline of about 4.64%, showing an accelerating downward trend; on Sunday, it touched the week's lowest point of 111,920 points before rebounding, closing with a green candle. The week ultimately closed with a large green candle with a 4.55% decline. The highest price of 119,800 points was close to the predicted resistance level of 120,250 points, the lowest price of 111,920 points was only 60 points away from the predicted strong support zone's upper limit of 111,980 points, and the closing price of 114,208 points was almost identical to the predicted first support level of 114,200 points.
The author believes that this week's trend largely matched the prediction. Next, the author will analyze the changes in the market from multiple dimensions.
1, As shown in Figure One, from the weekly chart:
①, Momentum Quantitative Model: Continuously sending high-level blunting signals, which is a precursor to forming a top divergence. Momentum Line 1 is gradually flattening from an upward state, and the volume (red) column is shorter than last week, indicating an increased probability of forming a momentum top divergence in the coming weeks.
②, Sentiment Quantitative Model: Two sentiment indicators have left the high-level area and are slowly declining. The peak indicator is 2.67, reduced from last week. These data suggest that the market's overbought enthusiasm is cooling down.
③, Digital Monitoring Model: No digital signals are currently displayed.
2, As shown in Figure Two, from the daily chart:
①, Momentum Quantitative Model: After forming a daily-level momentum top divergence, Momentum Line 1 is accelerating downward, with the energy (green) column gradually increasing, quickly releasing short momentum. ②, Sentiment Quantitative Model: Two sentiment indicators are slowly declining, indicating a downward adjustment at the daily level.
③, Volume-wise: Trading volume is gradually expanding, showing a volume-increasing downward trend.
3, As shown in Figure Three, from the hourly chart:
①, The previously predicted 112,000 is indeed an important support level, with a small hourly-level bottom pattern forming at this price and retesting around 115,000. If 115,000 can effectively support it, the price is expected to return to the oscillation box (115,000-120,000);
②, However, if 115,000 cannot hold steady and subsequently breaks below the key support level of 112,000, it can be confirmed from the hourly level that this round of rise has been blocked around 115,000 at the daily level, with the rebound failing. Once 112,000 is lost, the downward trend may officially begin.
II. Next Week's Market Forecast: (08.04 ~08.10)
1, When the index adjusts to the strong support zone between 111,980 and 110,530 points, it will produce a rebound; after the rebound, it will continue to fall and retest the support strength. The author believes that effectively breaking through this week is unlikely.
2, Upward Resistance Levels: The first resistance level is around 116,800 points, and the second resistance level is around 120,250 points.
2, Downward Support Levels: Strong support is between 111,980 and 110,530 points, with a focus on the support strength in this area.
III. Next Week's Operating Strategy (Excluding Unexpected News Impact): (08.04 ~08.10)
1, After forming a daily-level momentum top divergence, the operating strategy shifts from an aggressive long mindset to a defensive mindset, being cautious of accelerated decline risks.
2, Medium-term Position: Last week, the author suggested investors sell about 25% of their medium-term positions. As the index has now broken below the lifeline, it is again recommended to sell the remaining long positions, reducing the position to around 30% of the original medium-term position, and hold cash. Continue to observe the gains and losses of the long-short channel and then develop an operating strategy.
3, Short-term Position: Based on the predicted support and resistance levels, set stop-loss points. It is recommended to primarily short at high levels and sell at appropriate times during rapid index declines.
4, If investors want to receive the latest operational insights daily, it is recommended to follow the "Bitpush TG Exchange Group" below the article, where the author's daily market commentary can be read to obtain the latest operational insights in real-time.
The various models mentioned above are the trading rules followed by the author during operations and do not constitute any basis for buying or selling. Personal opinions, for reference only.
Author: Cody Feng
Twitter:https://twitter.com/BitpushNewsCN
Bitpush TG Exchange Group:https://t.me/BitPushCommunity
Bitpush TG Subscription: https://t.me/bitpush


