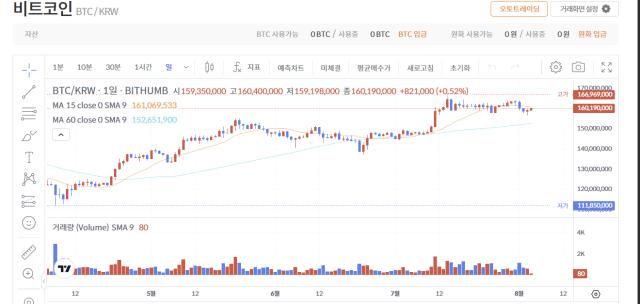
Bit price rose by 1.1% in a day, trading at around $114,000. However, looking at the weekly performance, it still shows a -3.77% decline, leaving traders wondering if this is just a simple rebound or the start of the next BTC rally.
To determine this, looking beyond the chart helps. On-chain signals from Longing holders, valuation trends, and trader sentiment are beginning to align, all pointing to one major BTC price level.
Old Holders, Selling Pressure Easing
Most significant adjustments begin when holders sell. So we are paying attention to the currently used output bands.
From July 23 to August 1, the 7-10 year used output band slightly widened. This means Longing-term wallets that have held Bit for almost 10 years are moving coins. This selling pressure previously occurred between July 10 and July 19 when the Bit price adjusted from $123,000 to $117,000.
However, selling pressure by Longing-term holders has been steadily decreasing since peaking on July 4.
Note: The band from July 10-July 19 was wider than the band from July 23-August 1, clearly showing a decrease in Longing-term holders' selling intentions.
During the current band expansion period (July 23-August 1), Bit has maintained above $113,000, showing the market is absorbing supply. This is a signal of BTC price strength.
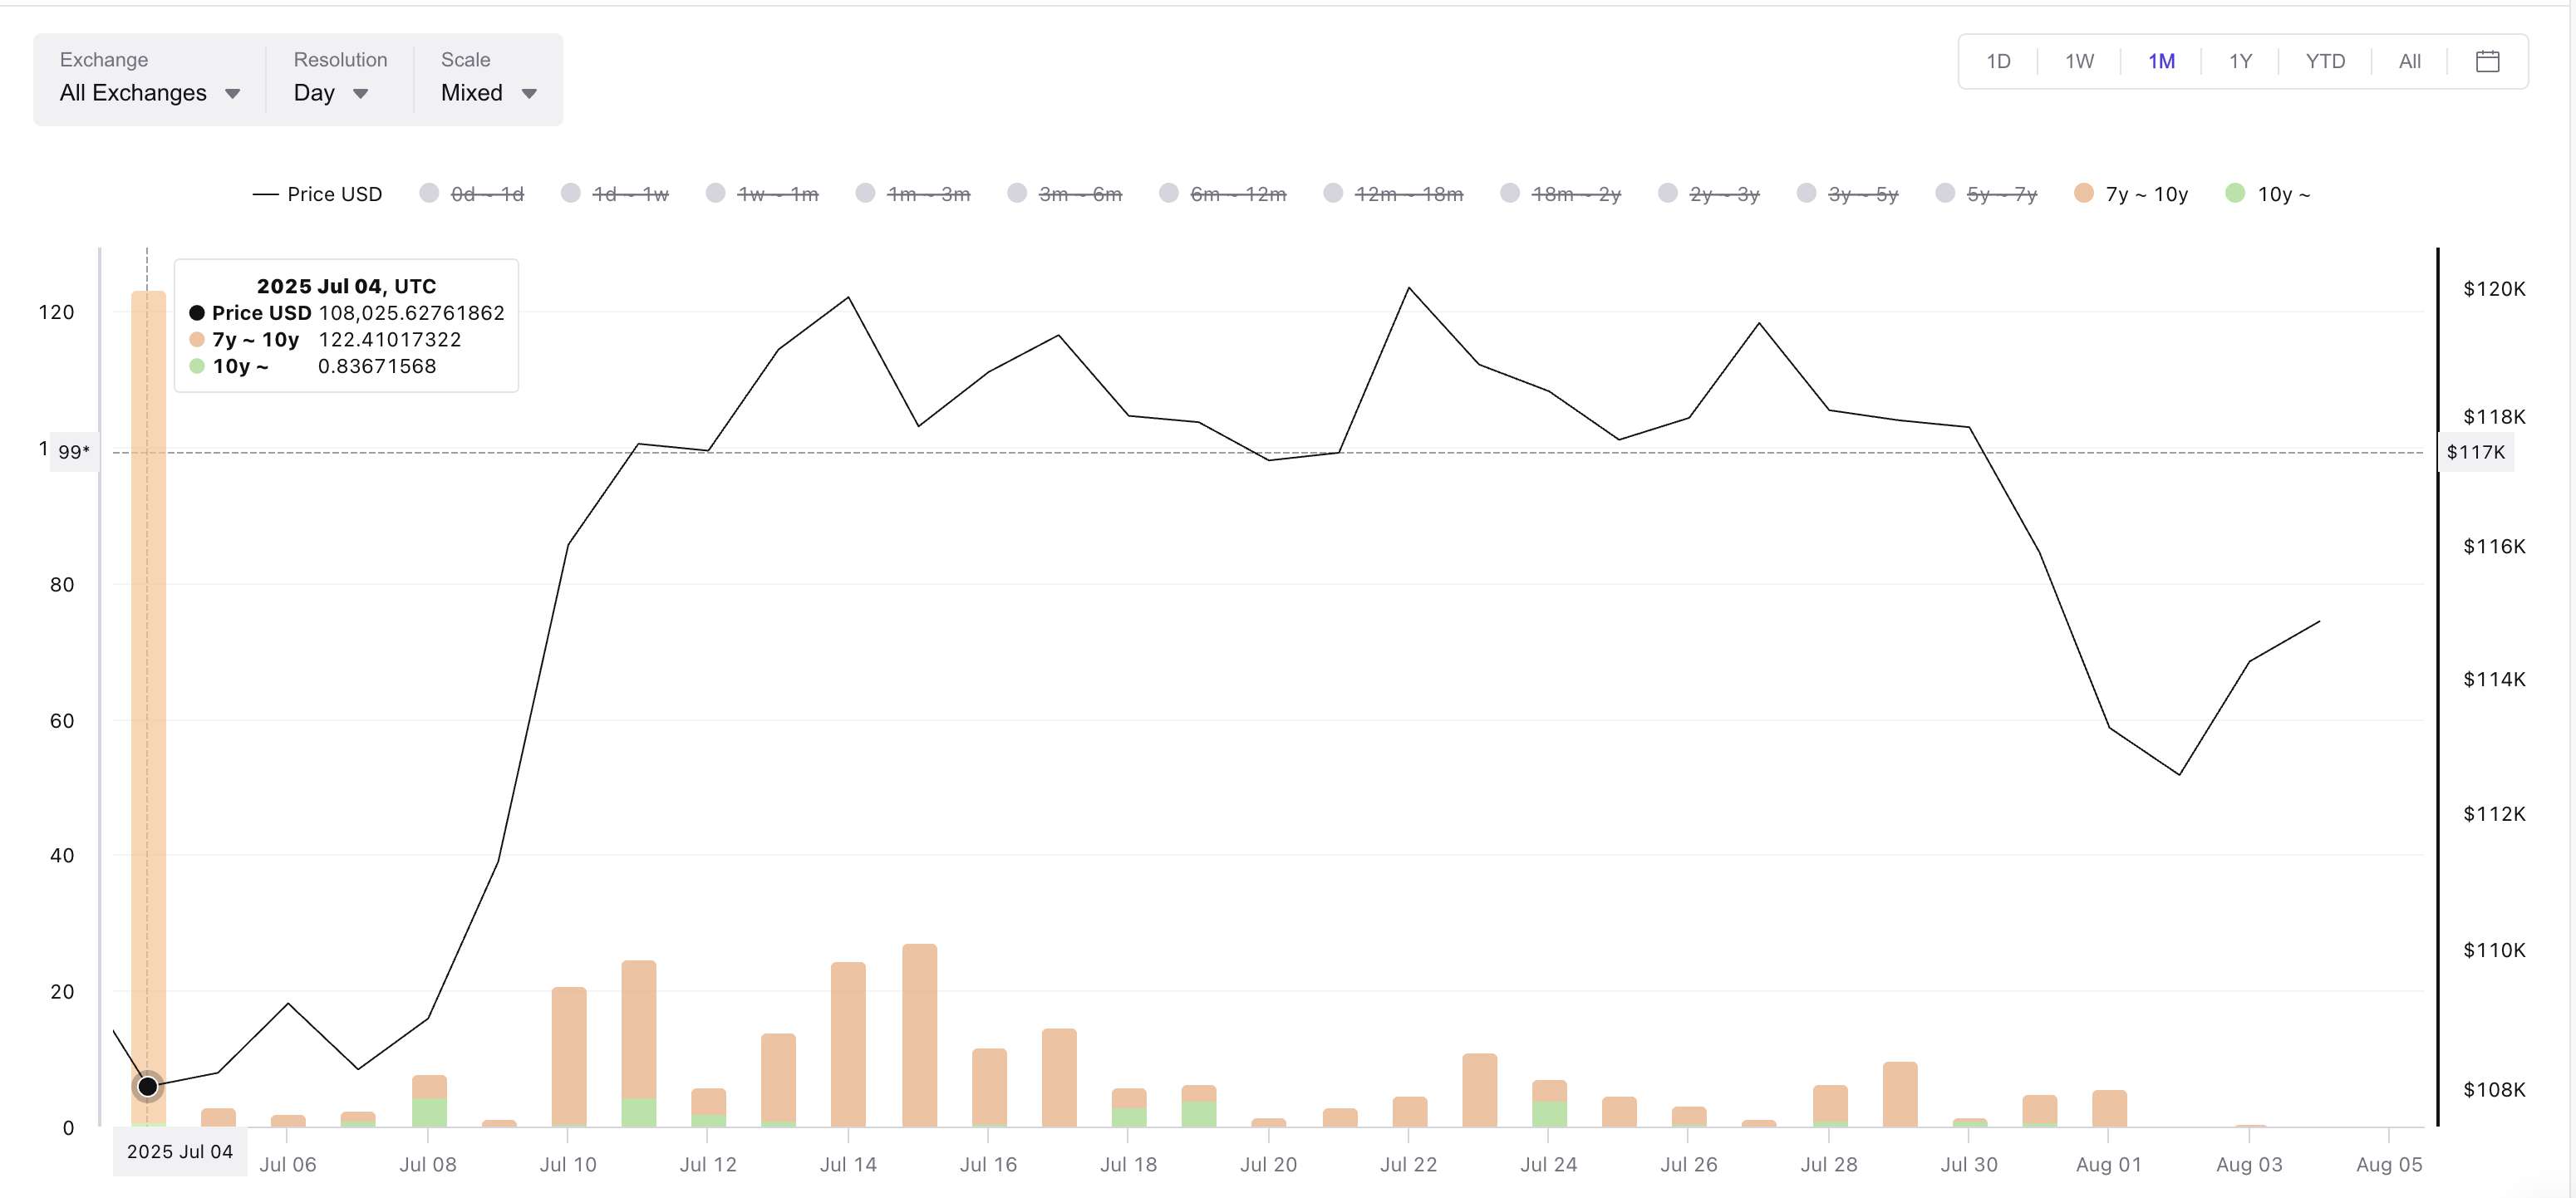
That selling pressure seems to be disappearing. The same used output band is now thinning, indicating that massive movements by old holders have calmed down. When these wallets stop selling, it often signals the end of a correction phase.
Used output bands show when coins of various ages move. Wide and thick bands mean more movement. When old bands thin out, it means supply pressure is vanishing.
Token TA and Market Update: Want more such token insights? Subscribe to editor Harsh Notariya's daily crypto newsletter here.
MVRV Ratio Undervaluation Signal... Historical Strength
With supply stabilizing, the next question is valuation. For this, the MVRV (Market Value to Realized Value) ratio is showing familiar patterns.
Currently, MVRV is located at 2.19. This is the same zone that has triggered several rallies in recent months.
In June 2025, when it reached 2.16, the Bit price rose from $101,000 to $110,000 in just 6 days. In April, 2.12 led to movement from $101,000 to $119,000. In November 2024, 2.04 started a rally from $67,000 to $98,000.
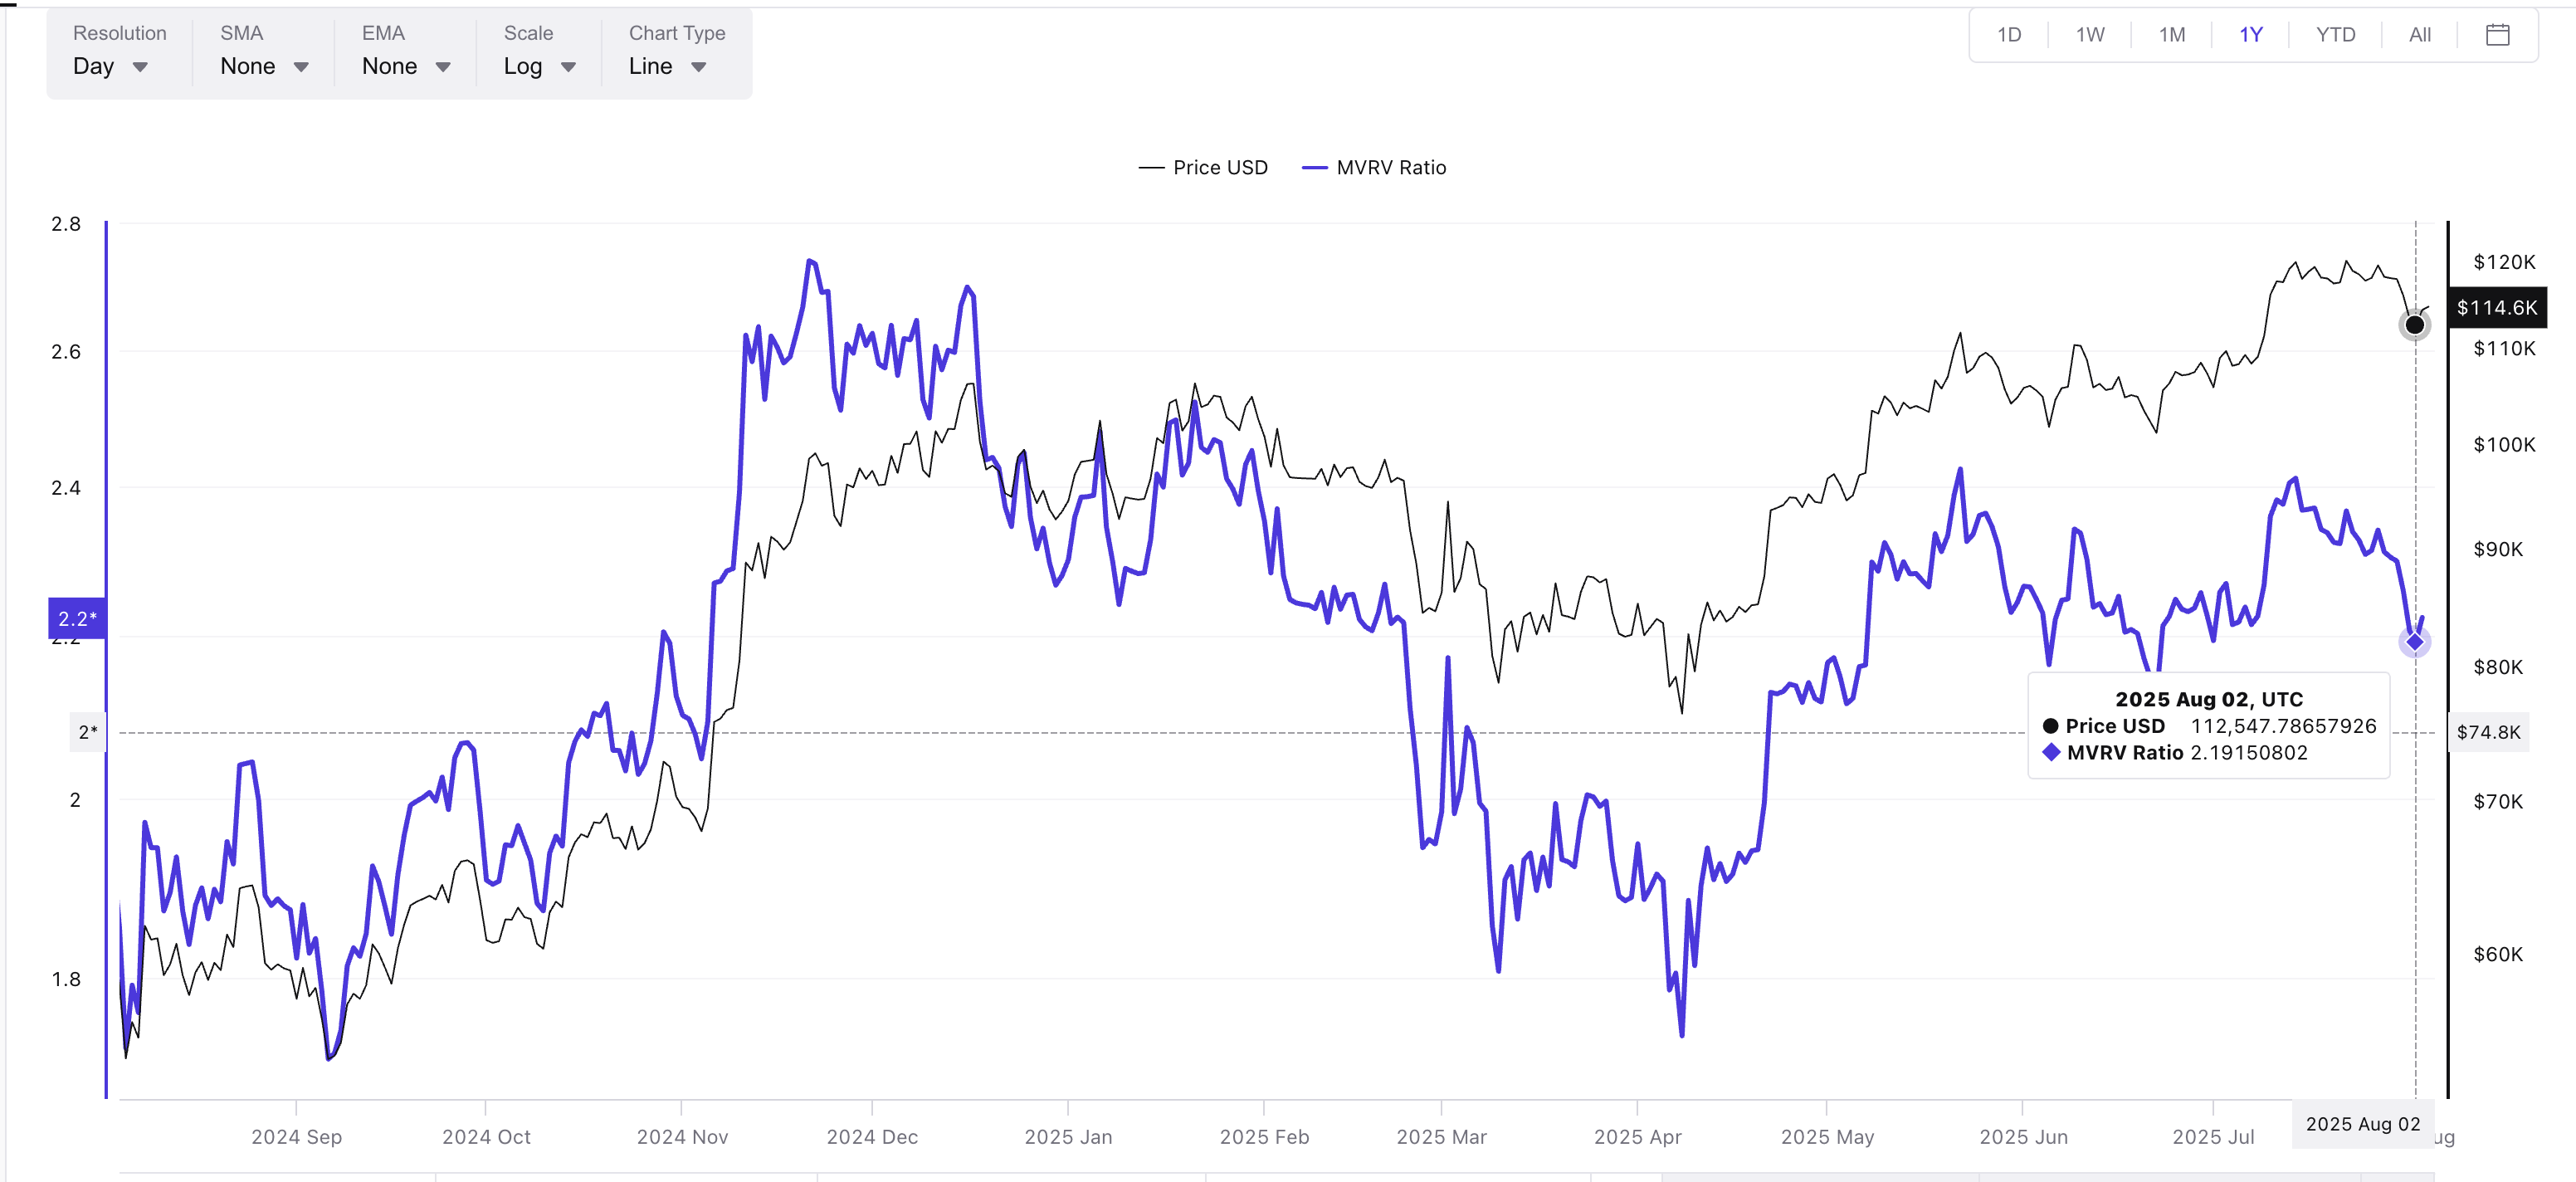
All rallies had one thing in common: they started when MVRV was just over 2, and Longing-term holders' supply was already exhausted. This is exactly the setup we are seeing now.
MVRV currently compares the BTC price to the average cost basis of all holders. A low ratio means growth potential, a high ratio means overheating. We are currently in the right position.
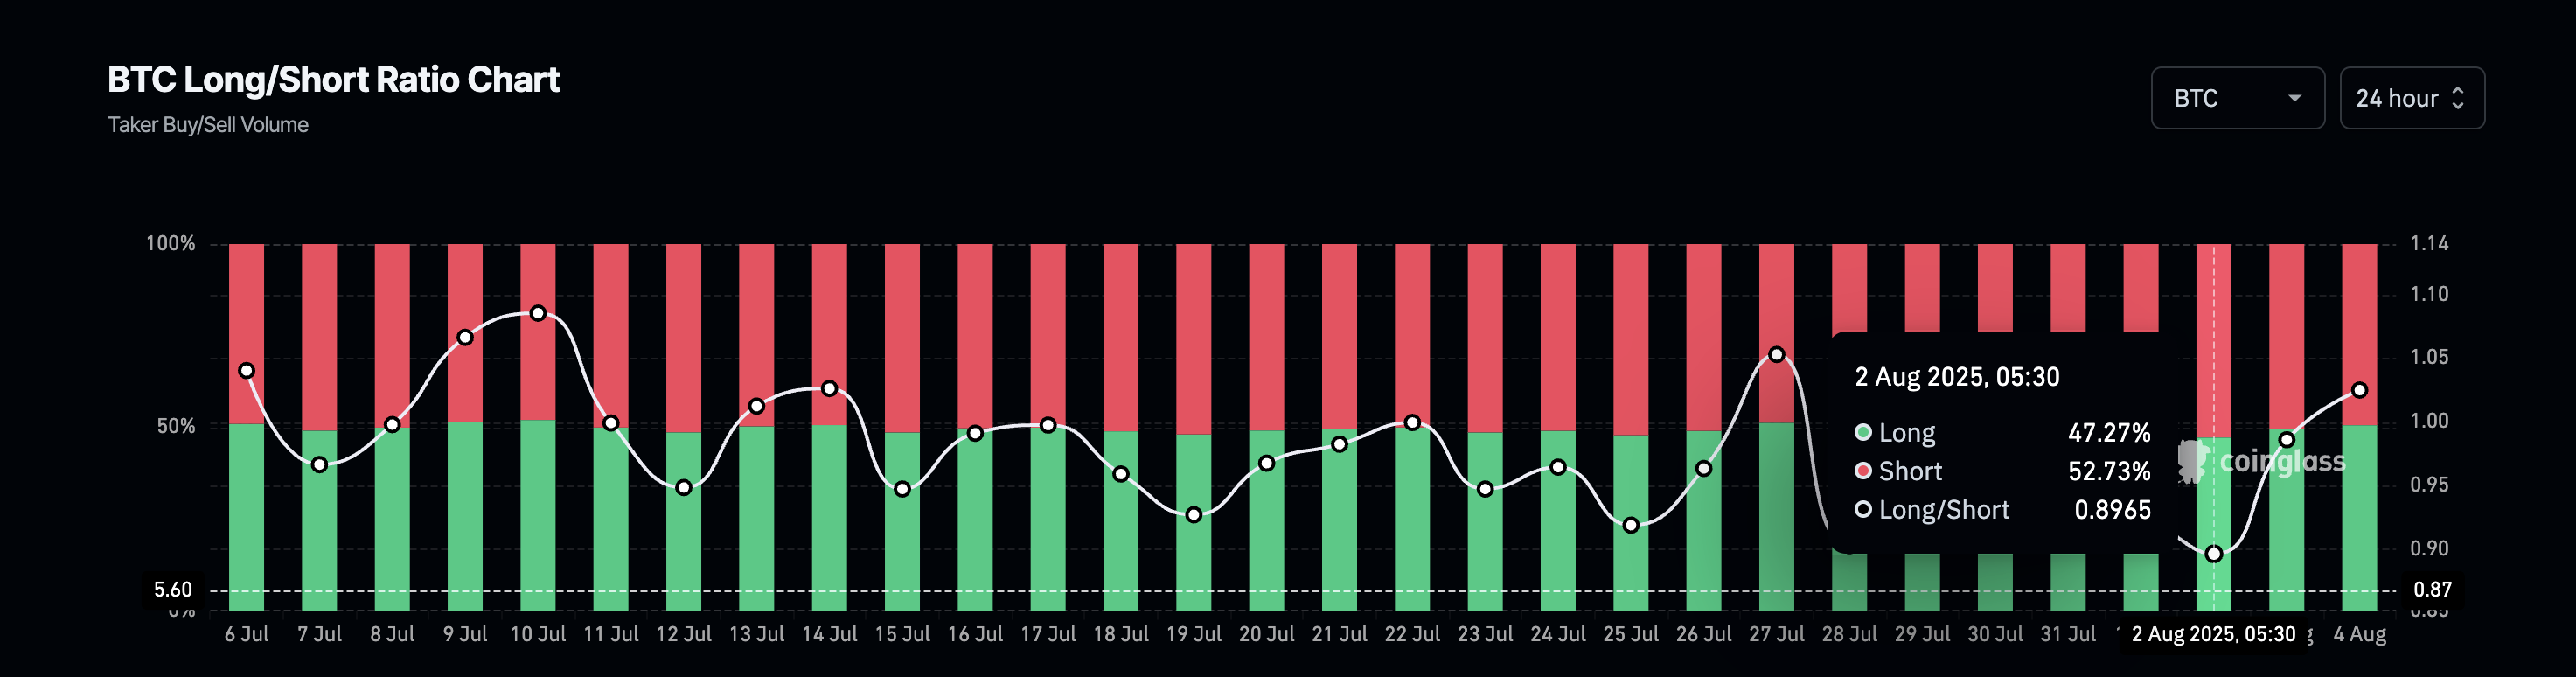
Even trader positioning is moving in the same direction. The Longing/Short ratio, which was 0.89 two days ago, has now switched to 1.02. A subtle change, but confirms more traders are preparing for an upward move, while the valuation signal suggests room for growth.
The conclusion? We are in the same position, supply pressure is decreasing, valuation is in the launch zone, and traders are quietly preparing.
Bit Price Needs to Break $117,000... Risk of Another Trap
On the chart, Bit price is just above the 0.382 Fibonacci retracement level at $113,600. This level was drawn from the June low of $98,000 to the all-time high of $123,000.
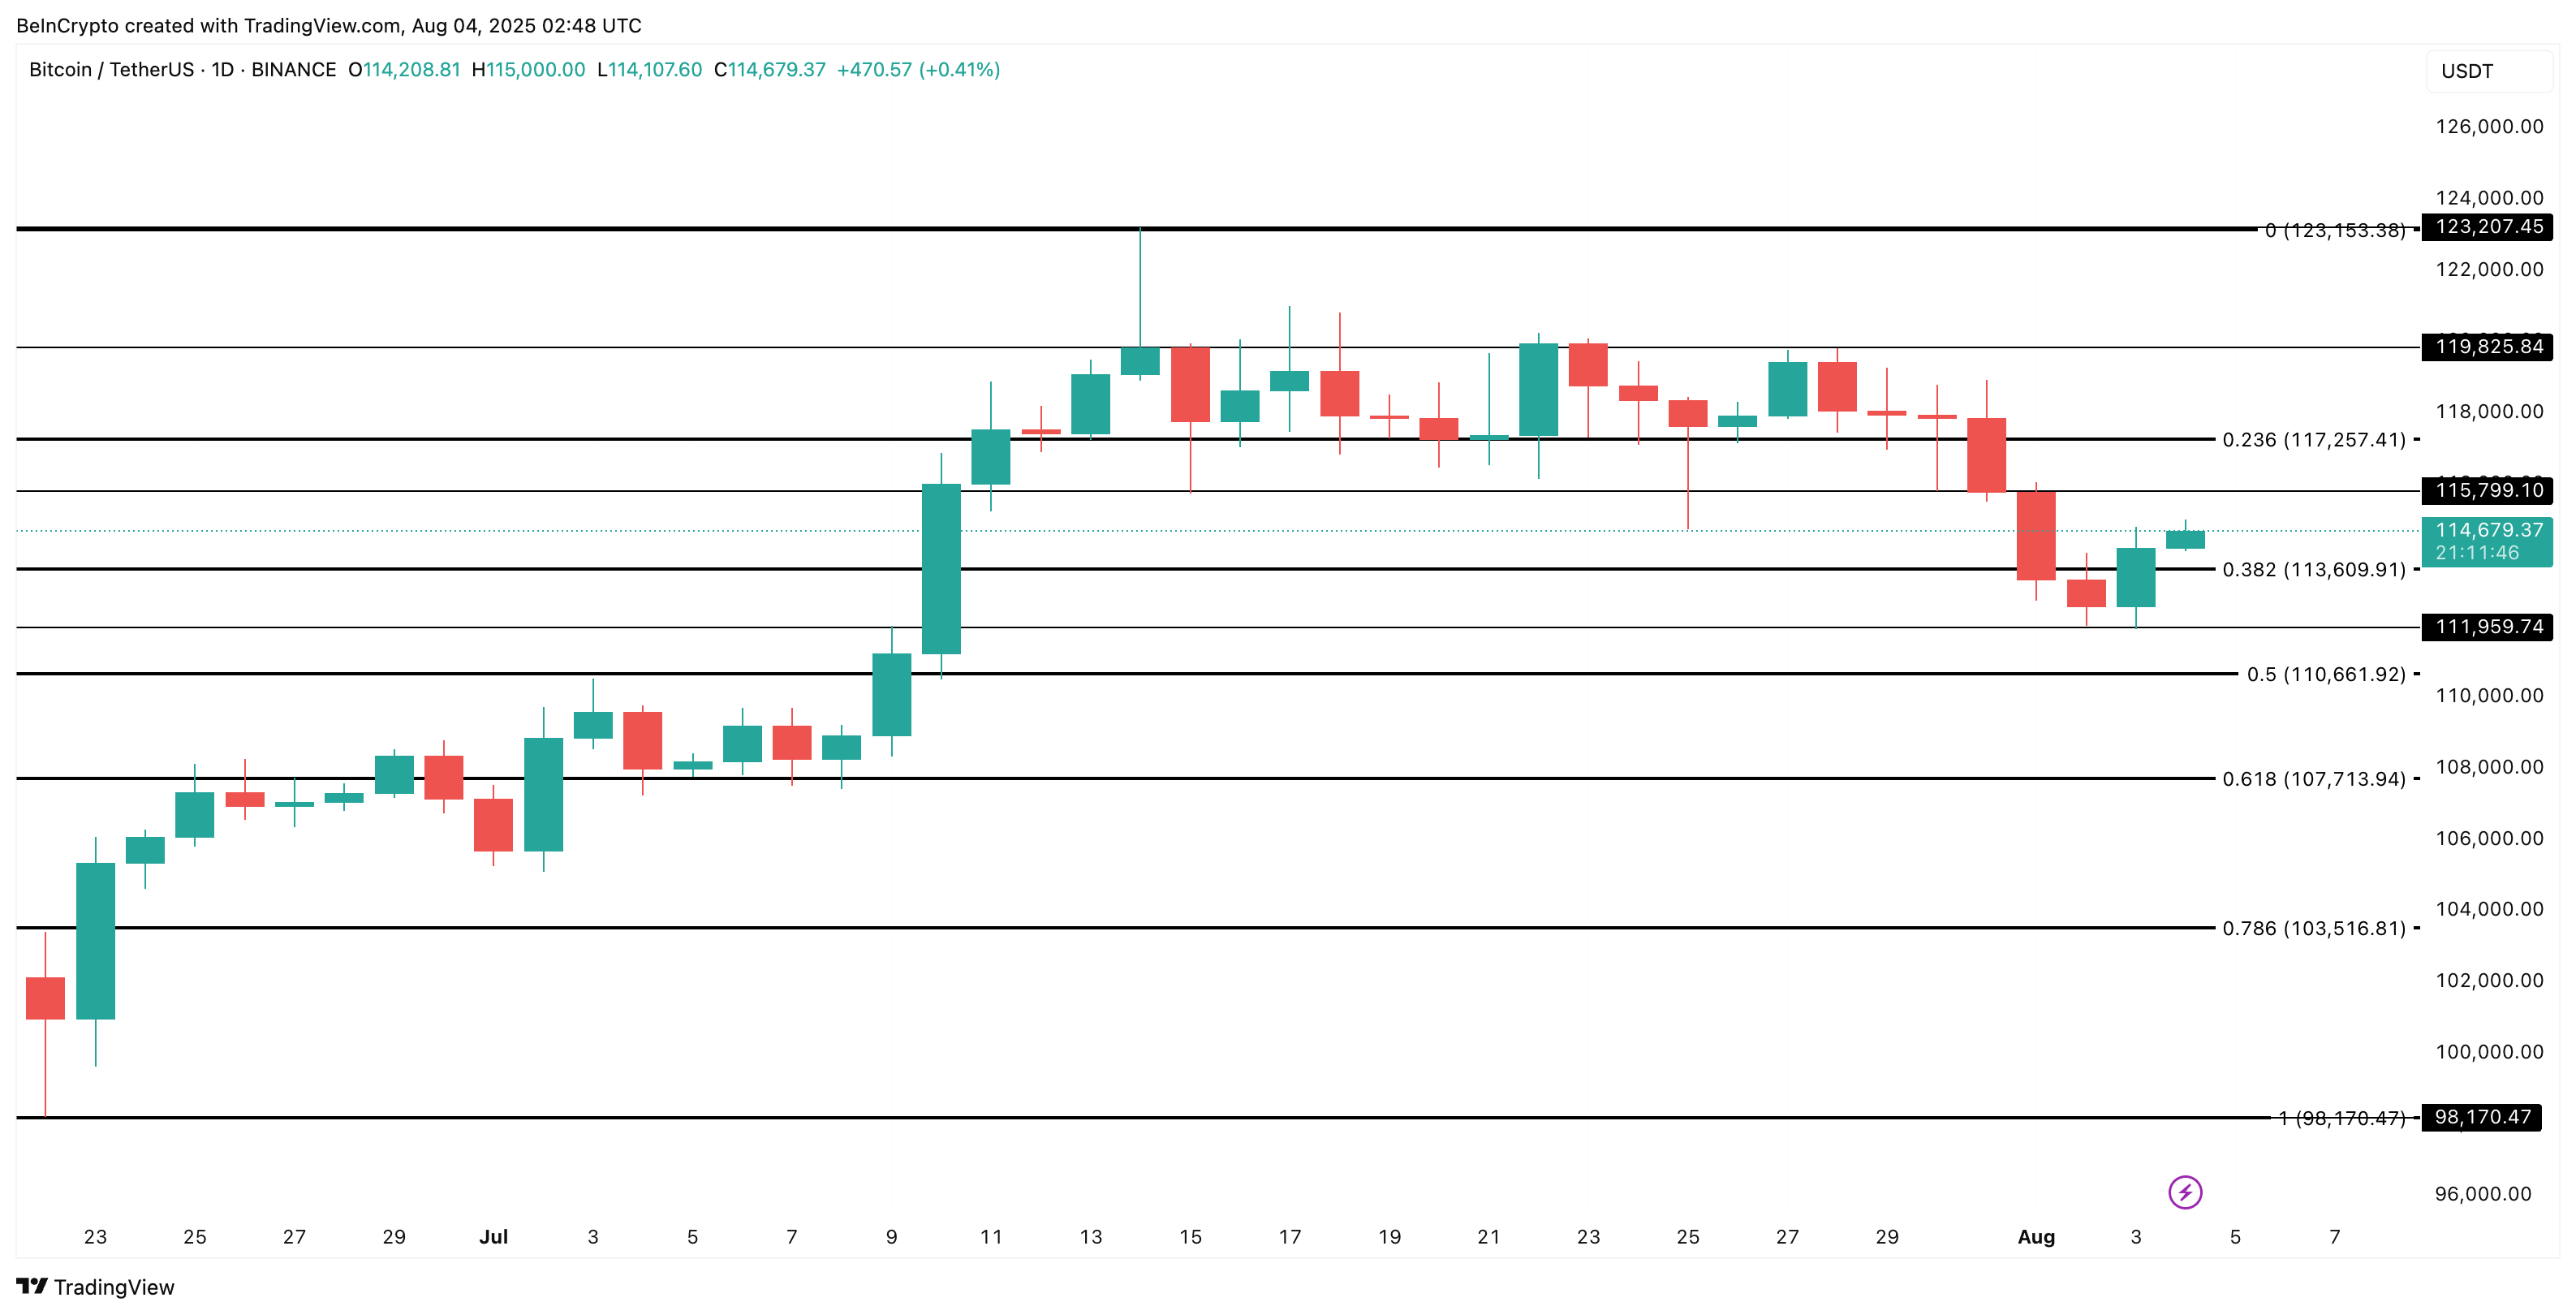
Below that, the BTC price support structure is located at $111,900 and $110,000. If buying pressure loses these levels, the next major support is at $107,000, which is also the invalidation point of the uptrend setup.
However, the big number everyone is watching is $117,000. According to the chart, the area above $117,000 shows the maximum candle density, indicating how critical a support/resistance it is.
If the price can break that level, it could trigger the next BTC rally. If not, we are likely to see another failed movement.