Stellar's native token XLM has been steadily declining since reaching a local cycle peak of $0.52 on July 18th.
Currently trading at around $0.39, this altcoin has lost 14% of its value in two weeks. This indicates an accelerating downward trend as the token enters a historically challenging month.
XLM August Curse Returns…Selling Signals Increase
A review of XLM's monthly returns revealed a concerning pattern. August only recorded positive monthly closings in 2017 and 2021. All other Augusts ended in the red.
Token Technical Analysis and Market Update: Want more such token insights? Subscribe to editor Harsh Notariya's daily crypto newsletter here.
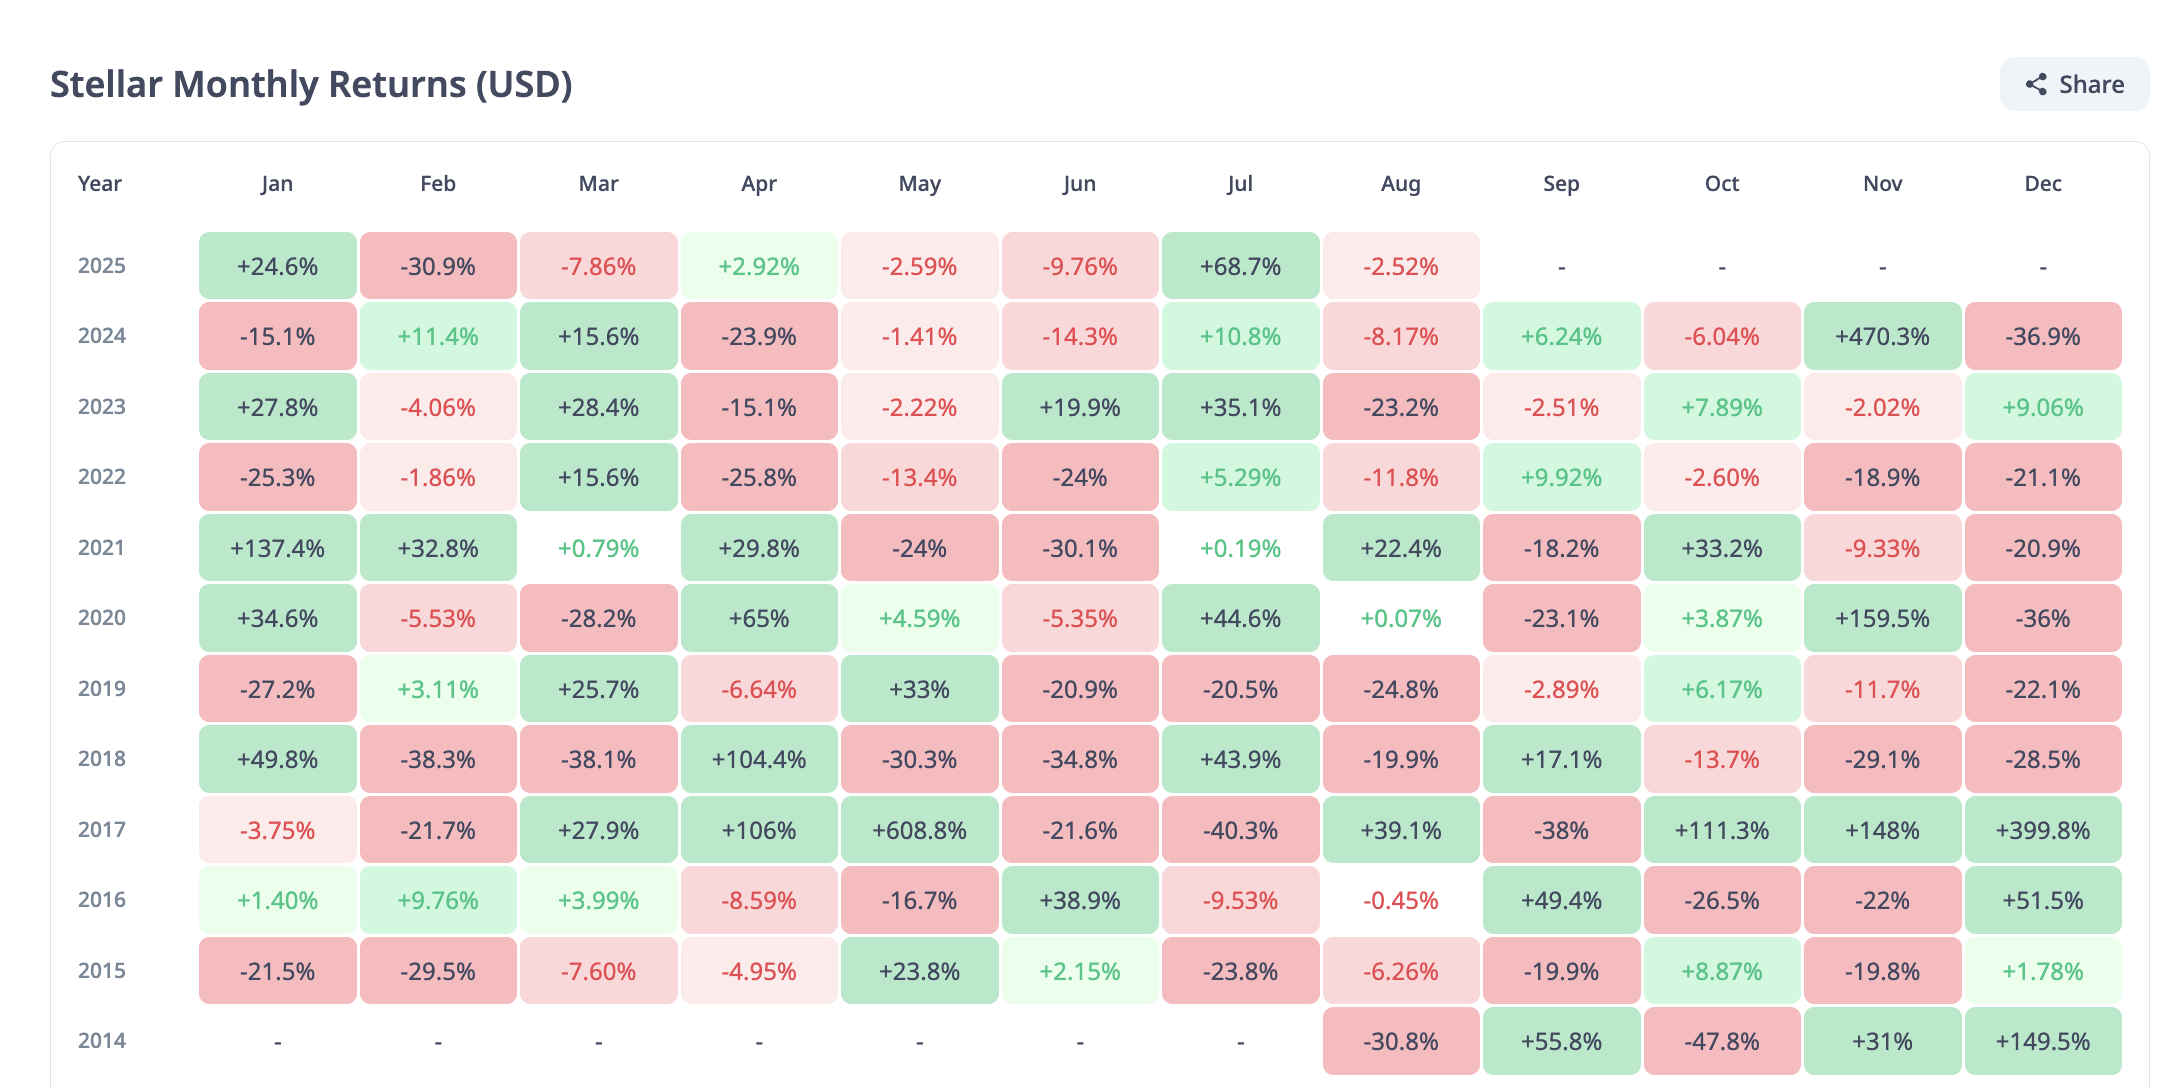
This record, intersecting with weakened technical indicators, sets the stage for a potential continuation of the downward trend as the new month begins.
Readings on the XLM/USD daily chart show that a double-digit decline in token value has pushed the price below the 20-day moving average (EMA). This key moving average forms a dynamic resistance above XLM at $0.40 at the time of reporting.
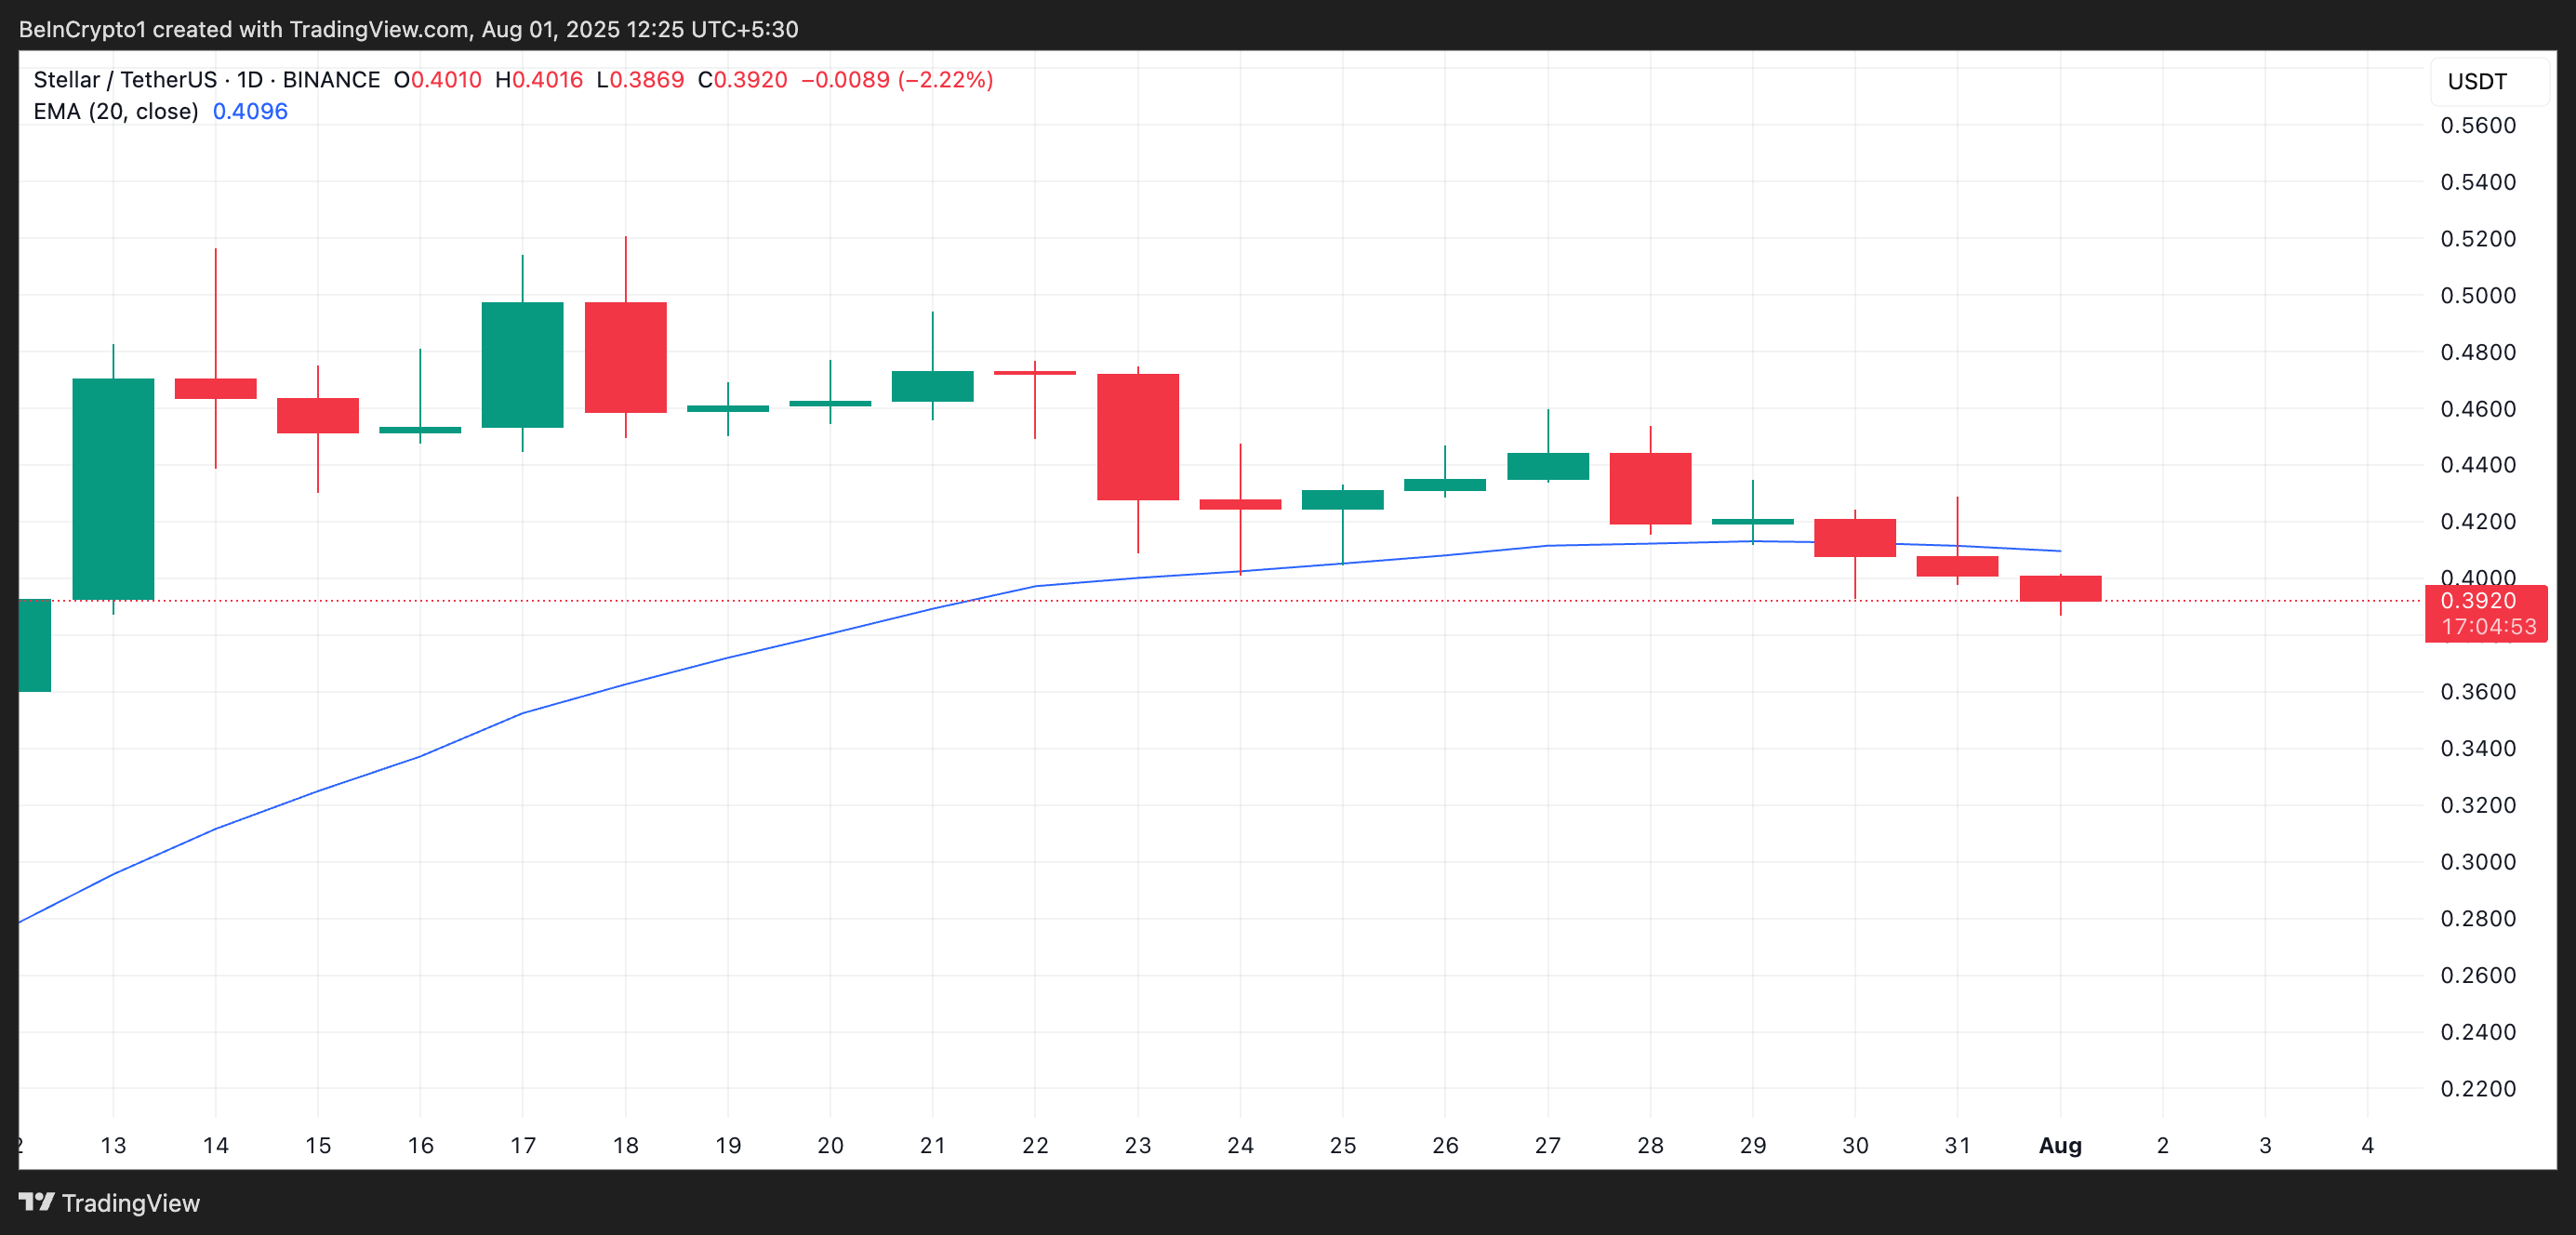
The 20-day EMA gives more weight to recent prices, measuring the average price of the asset over the past 20 trading days. When the price trades above the EMA, it indicates short-term upward momentum and suggests buyers are dominating the market.
Conversely, when an asset's price falls below the 20-day EMA, it indicates that short-term market sentiment has shifted from bullish to bearish. This is especially reflective of increasing selling pressure when combined with other declining indicators.
Adding to this bearish outlook is XLM's Chaikin Money Flow (CMF) dropping below the zero line. This is another warning signal suggesting continued decline in August. At the time of reporting, the CMF reading is at -0.03, indicating capital outflow in XLM's spot market.
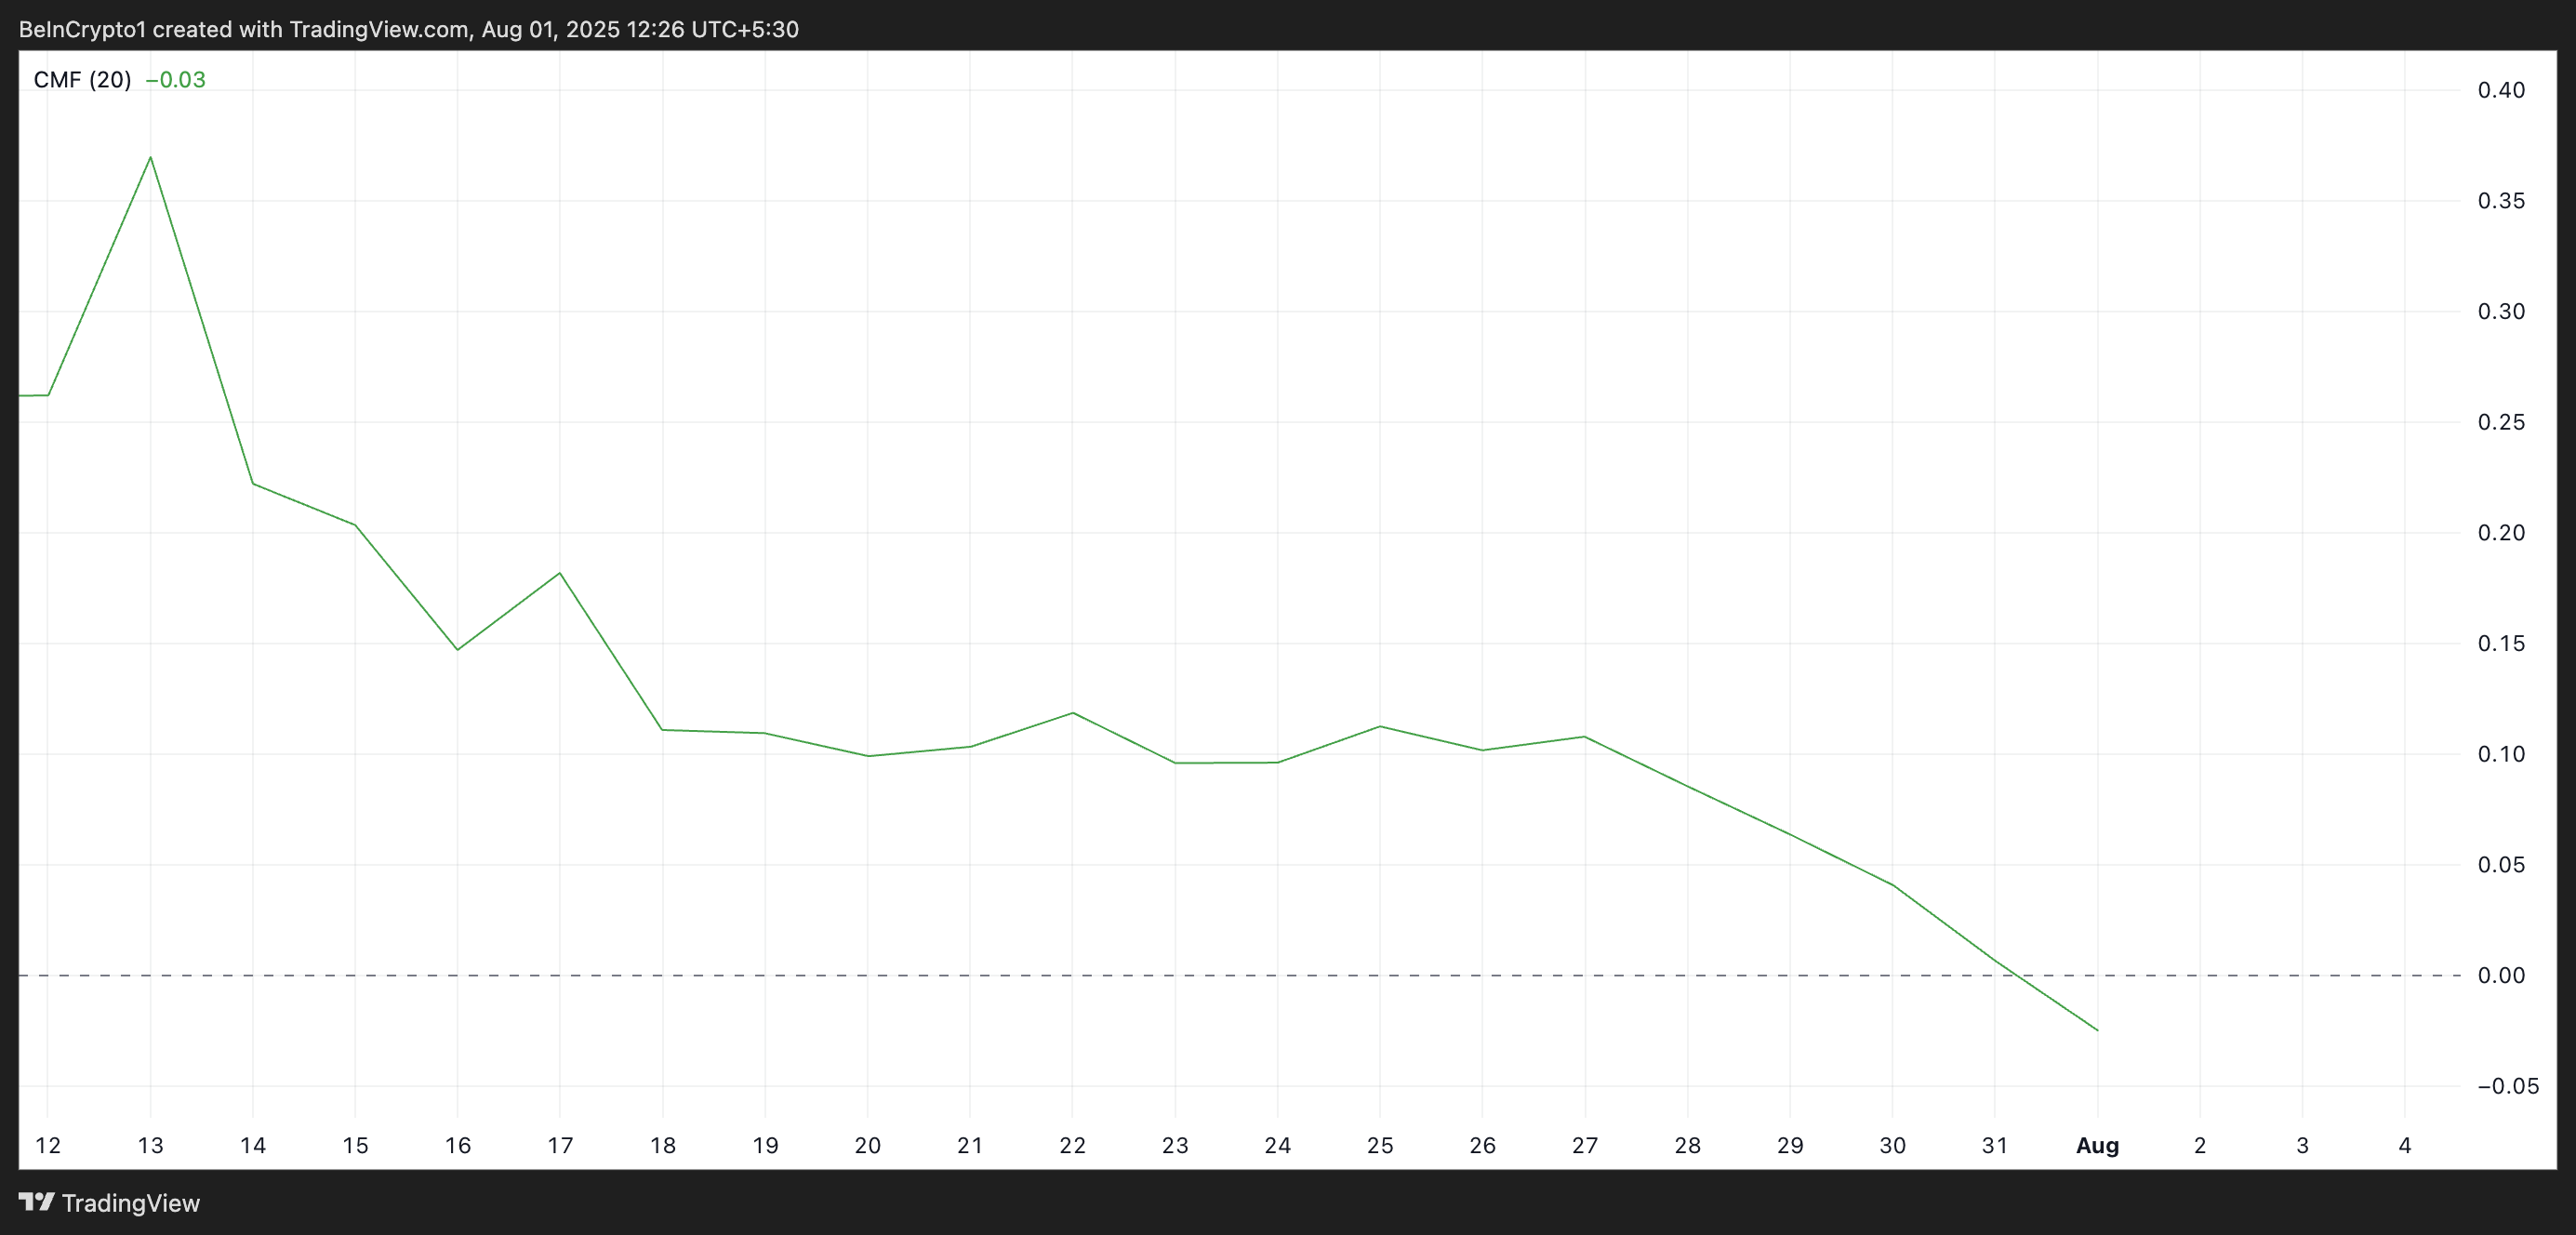
The CMF indicator measures capital inflows and outflows in an asset's market. When its value is positive, it indicates buyers are dominating and capital is flowing into the asset.
Conversely, a negative CMF reflects distribution. This means selling pressure is stronger and funds are leaving the asset. This trend suggests that XLM's continued price decline is supported by actual market weakness, not just short-term volatility.
Will it Drop to $0.32 or Rebound to $0.41?
XLM is currently trading at $0.39 at the time of reporting. Weakening demand for the altcoin and historically poor August performance suggest it could enter another short-term decline. With both price momentum and capital flow indicators signaling red flags, market sentiment is firmly tilting bearish.
If capital inflows continue to weaken, XLM's price could drop to $0.36. If this level does not hold, the decline could intensify to $0.32.
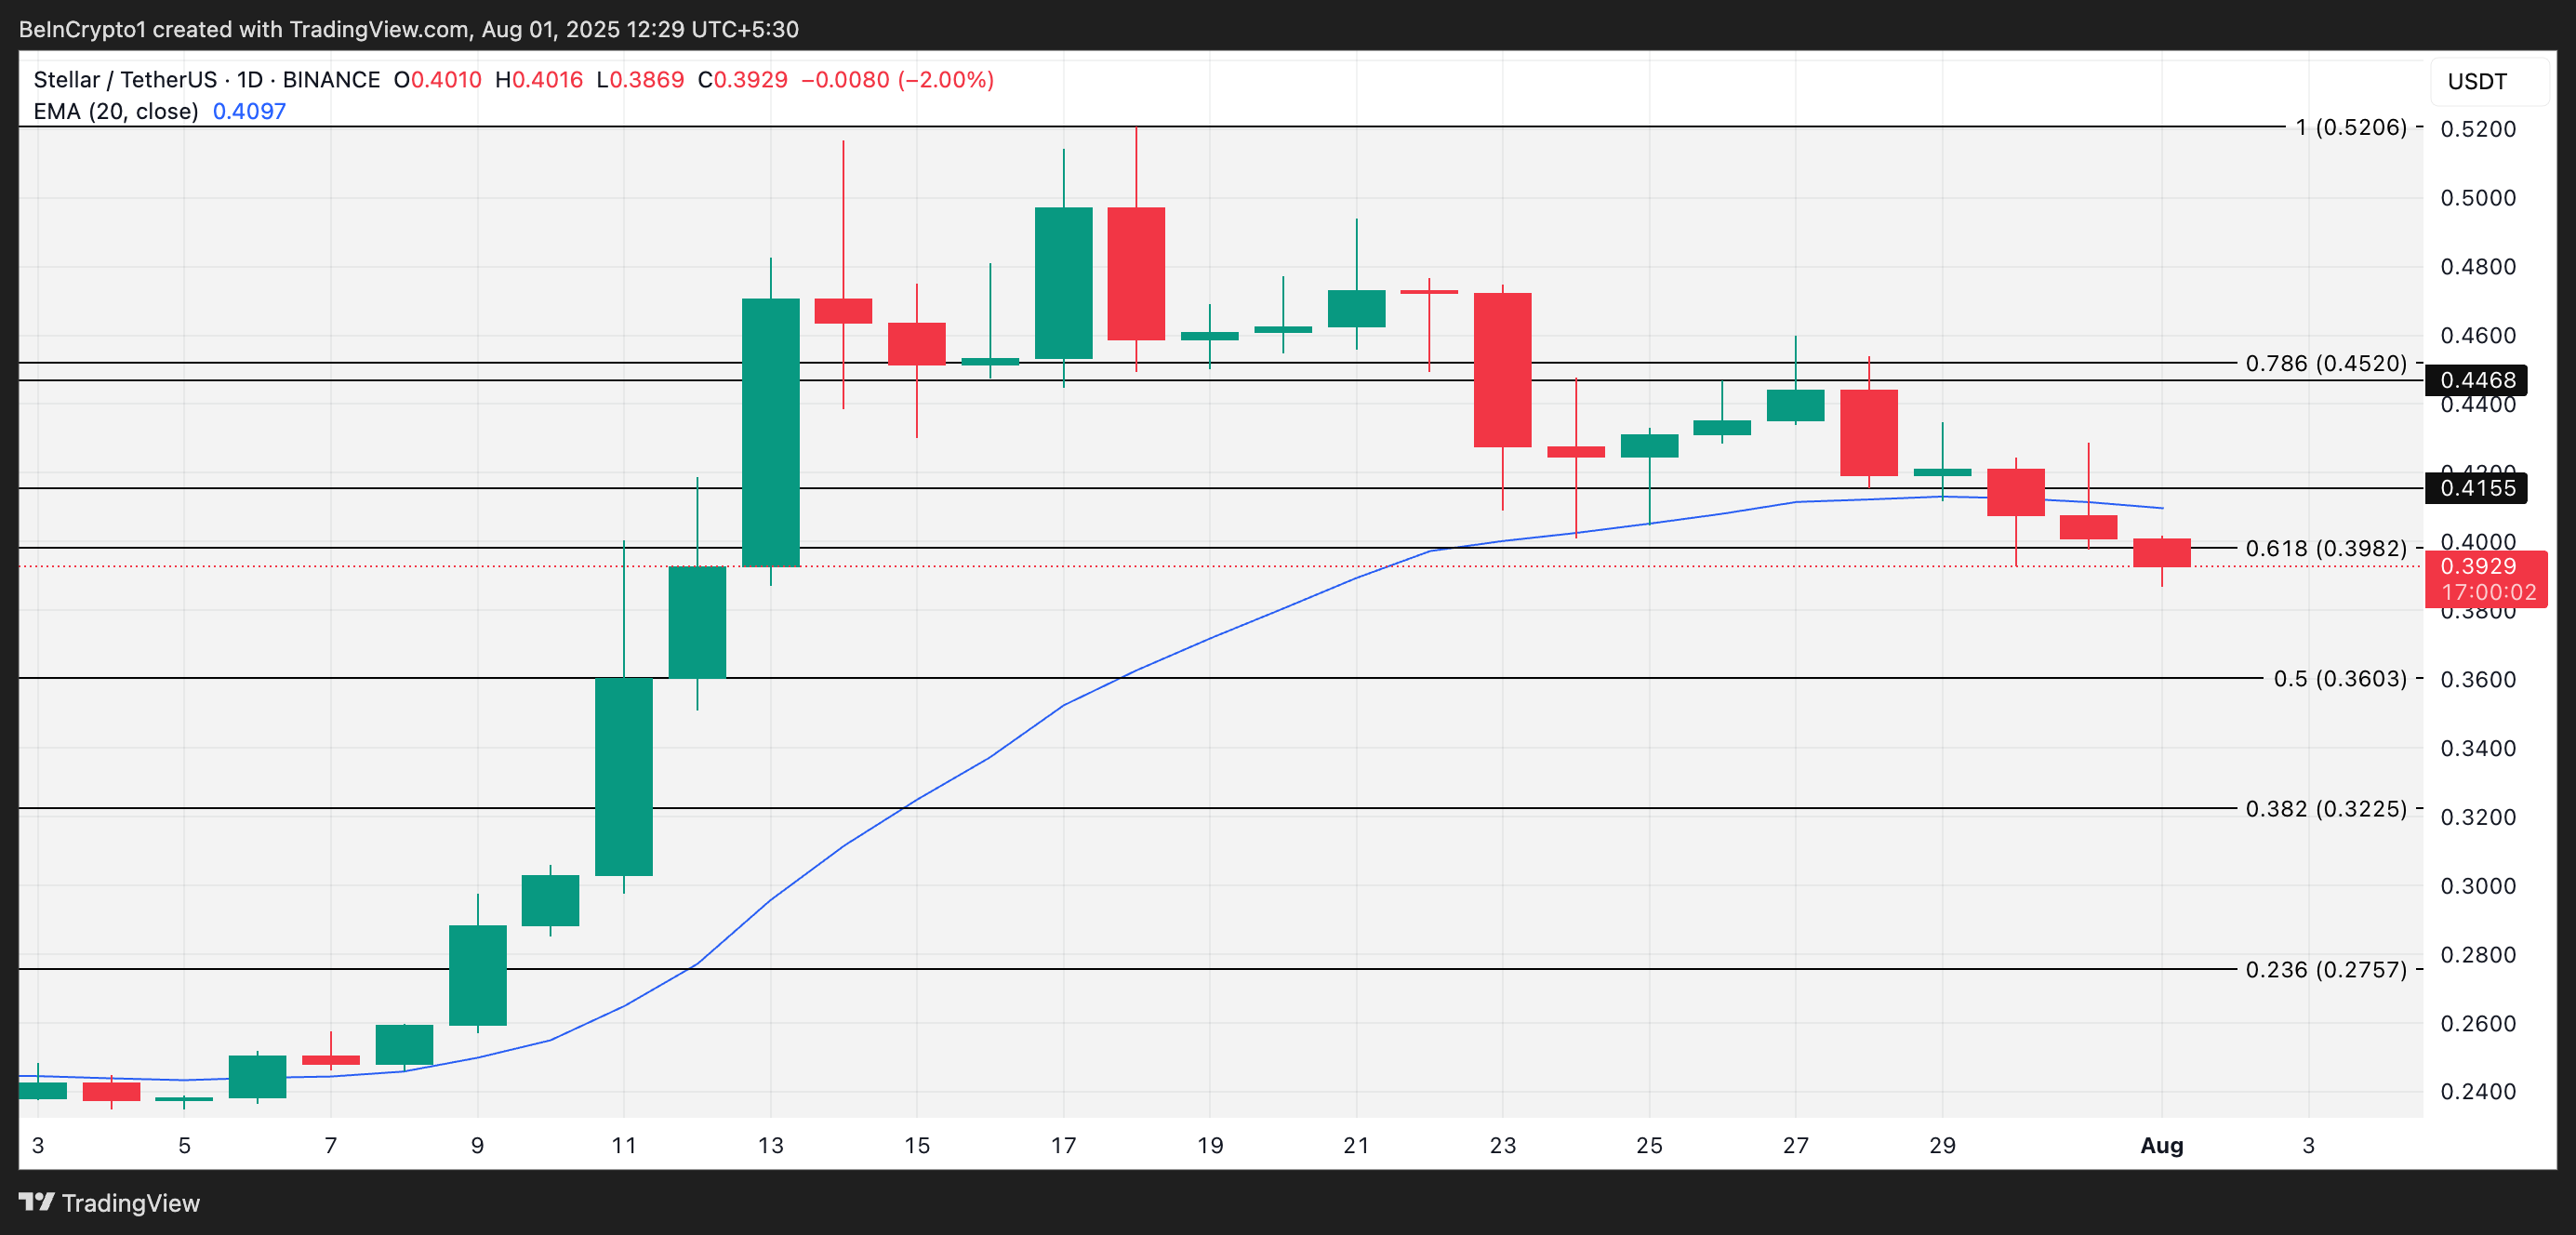
However, a reversal is still possible if buyer demand begins to recover. Continued accumulation could push XLM back above the 20-day EMA. If this breakout is maintained, the token could recover to $0.41, opening a short-term bullish reversal.