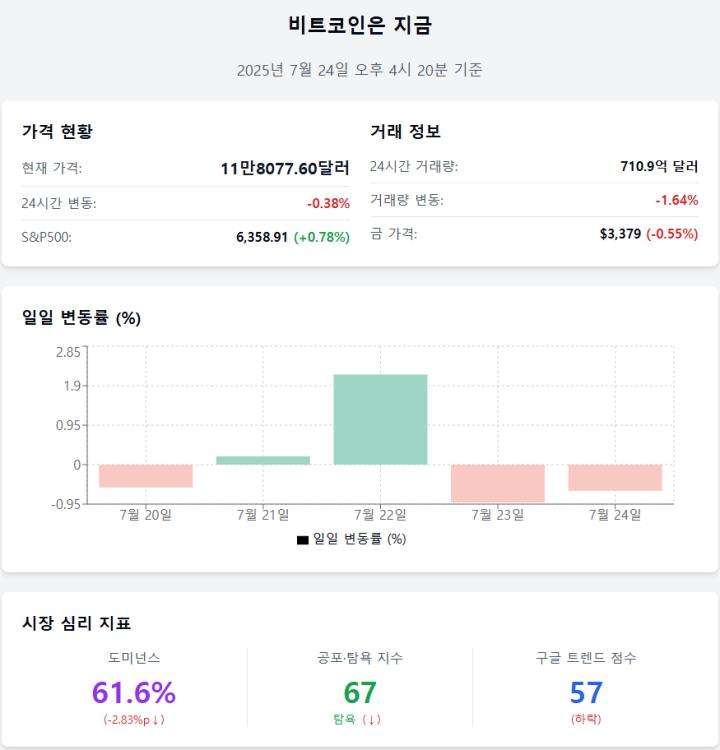
Bitcoin price is experiencing a difficult period today. As of the 25th, BTC price dropped to around $114,400 at one point. This is approximately a 6% decline from the all-time high of $123,000.
Retail traders are hoping for a rebound, but on-chain signals suggest deeper issues. Both whales and institutions seem to be stepping back, and the charts are not looking good.
Whale Activity, Bearish Picture
BTC price has currently dropped 6% from its all-time high of $122,838. There might be specific reasons lurking behind this decline.
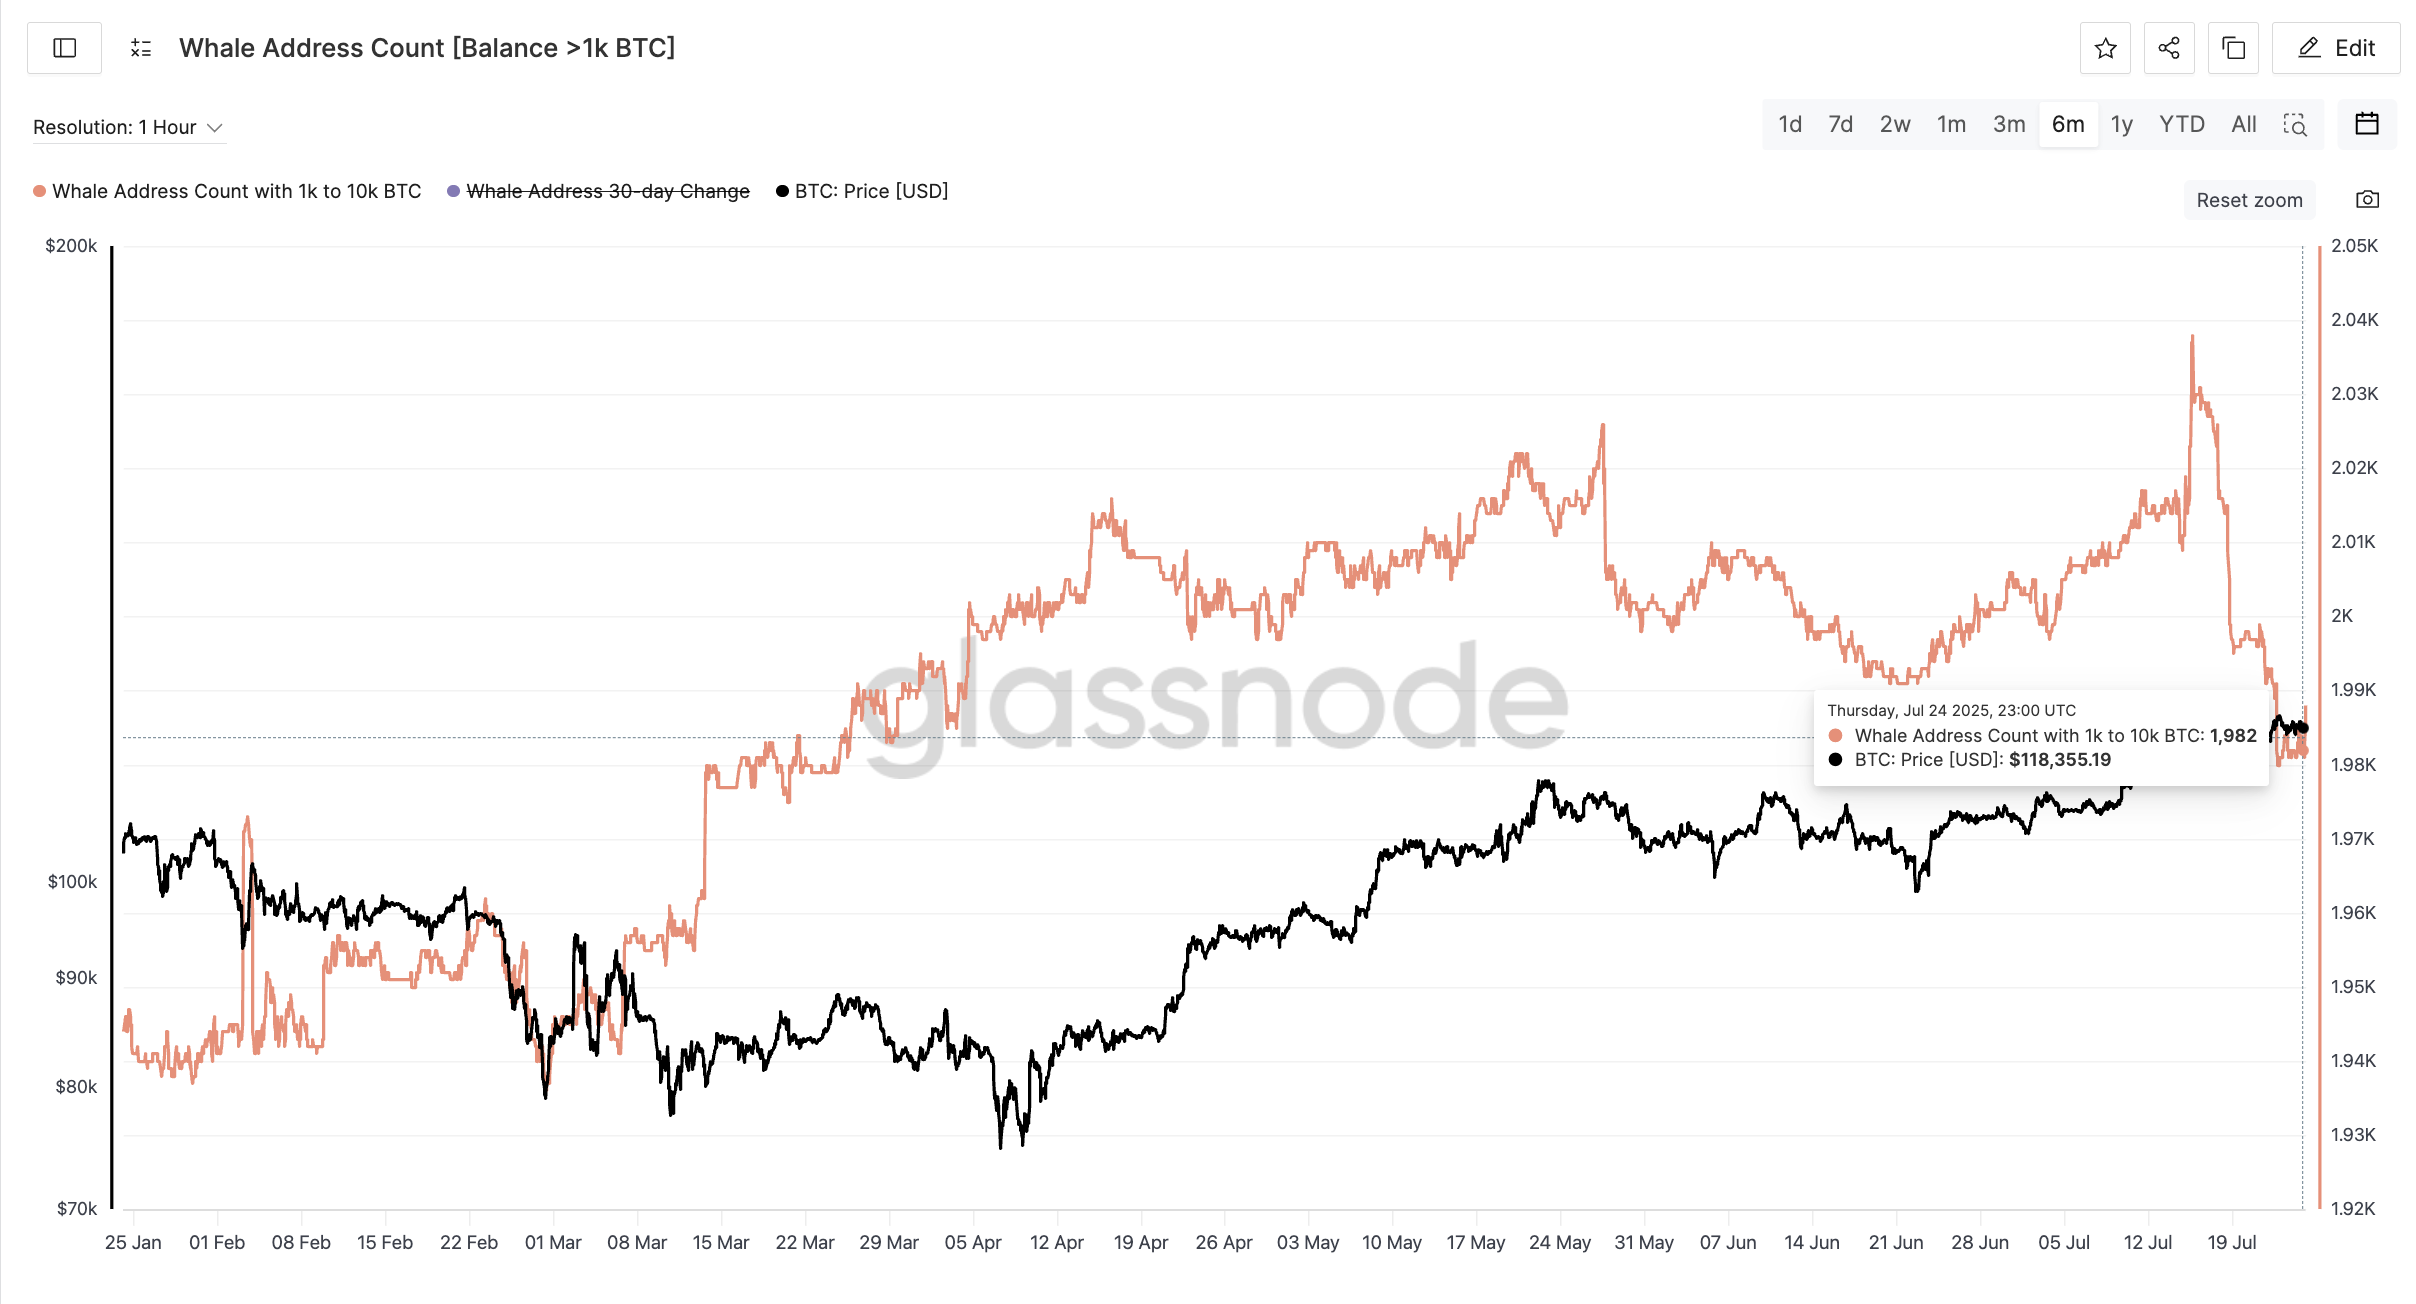
Over the past 10 days, the number of whale addresses holding 1,000 to 10,000 BTC has decreased from 2,037 to 1,982. This represents a 2.7% reduction in whale numbers, which is the steepest decline in whale participation in the last six months.
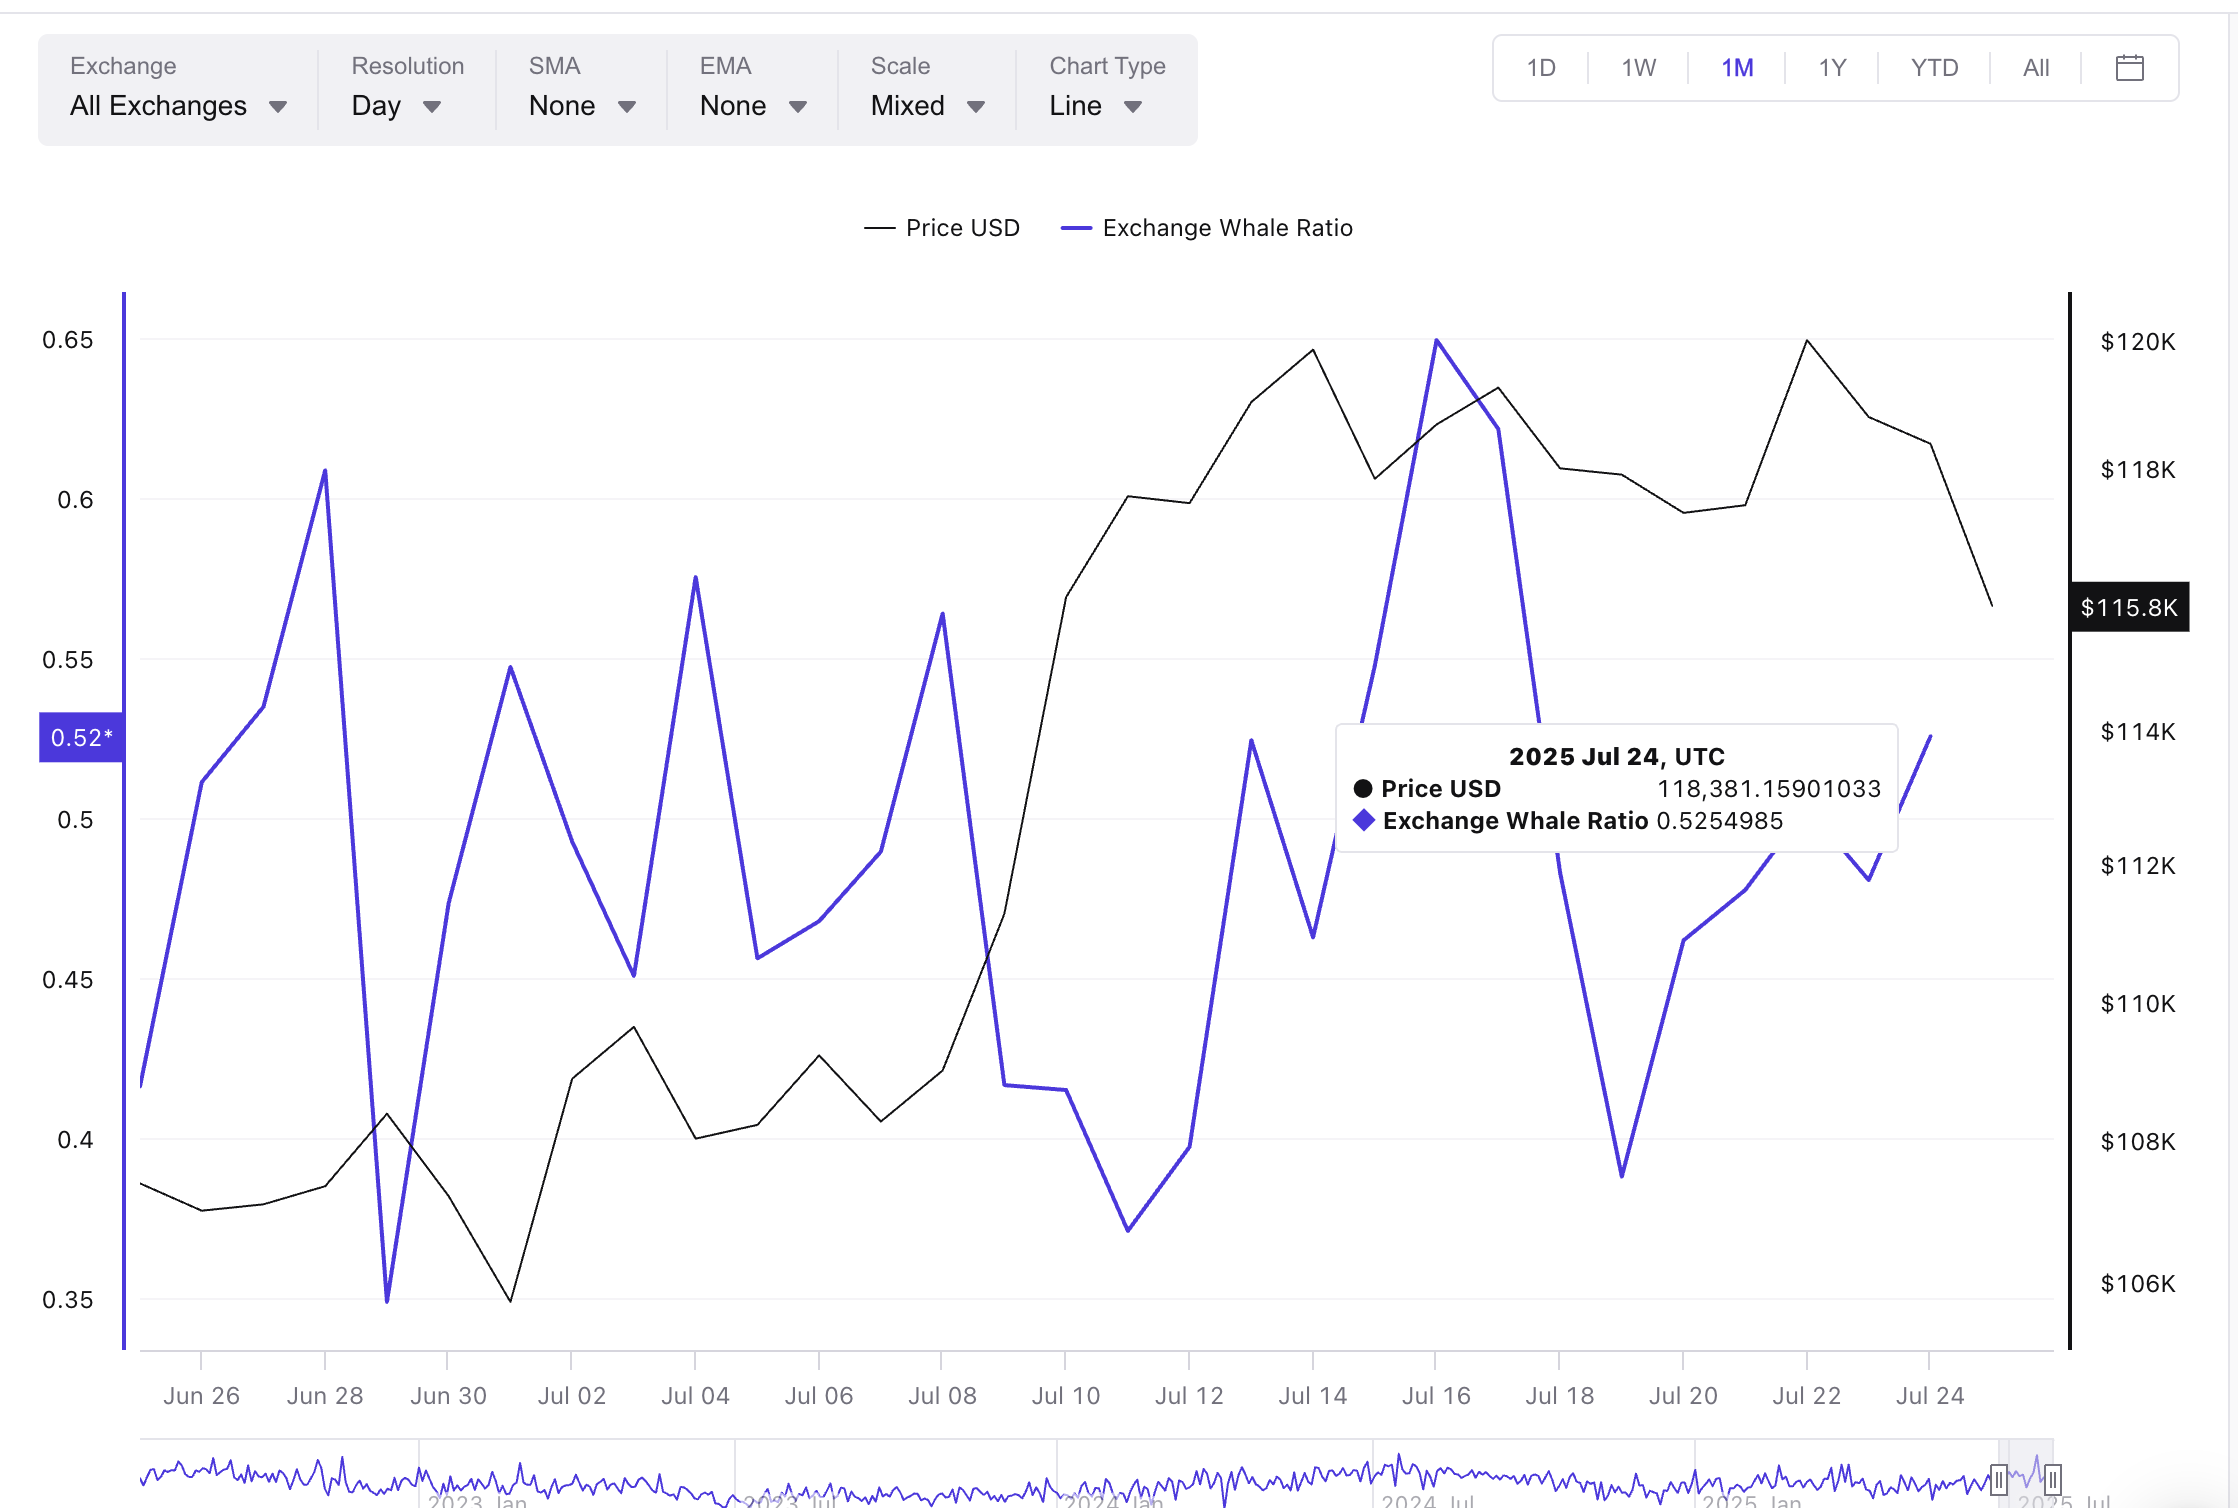
It's not just the decreasing wallet count. The whale exchange inflow ratio is also rising.
Historically, this ratio has recorded three consecutive lower highs on July 4th, 8th, and 13th. This coincides with BTC price reaching its all-time high. Now we are seeing high points again. The ratio was 0.5 on July 22nd and rose to 0.52 on July 24th, which is when BTC price began to decline.
This pattern suggests that whales are not simply leaving but sending coins to exchanges. If history repeats, more selling pressure could follow. Galaxy Digital is reportedly said to have deposited 10,000 BTC to exchanges recently, adding to institutional unease.
Note that #GalaxyDigital has deposited over 10,000 $BTC($1.18B) to exchanges in the past 8 hours!
— Lookonchain (@lookonchain) July 25, 2025
The 10,000+ $BTC comes from the Bitcoin OG holding 80,009 $BTC($9.68B).https://t.co/qaSj0NKwmD pic.twitter.com/09XEqB6VGg
Declining EMA Setup, Bearish Signal
This whale-driven weakness is now showing on the 4-hour chart. Smaller timeframes are often used to detect trends early.
BTC price has just fallen below the 100-period EMA (Exponential Moving Average), which is a key short-term support line. Even worse, the 20-period EMA (red line) is about to cross below the 50-period EMA (orange line). This suggests a bearish "death cross".
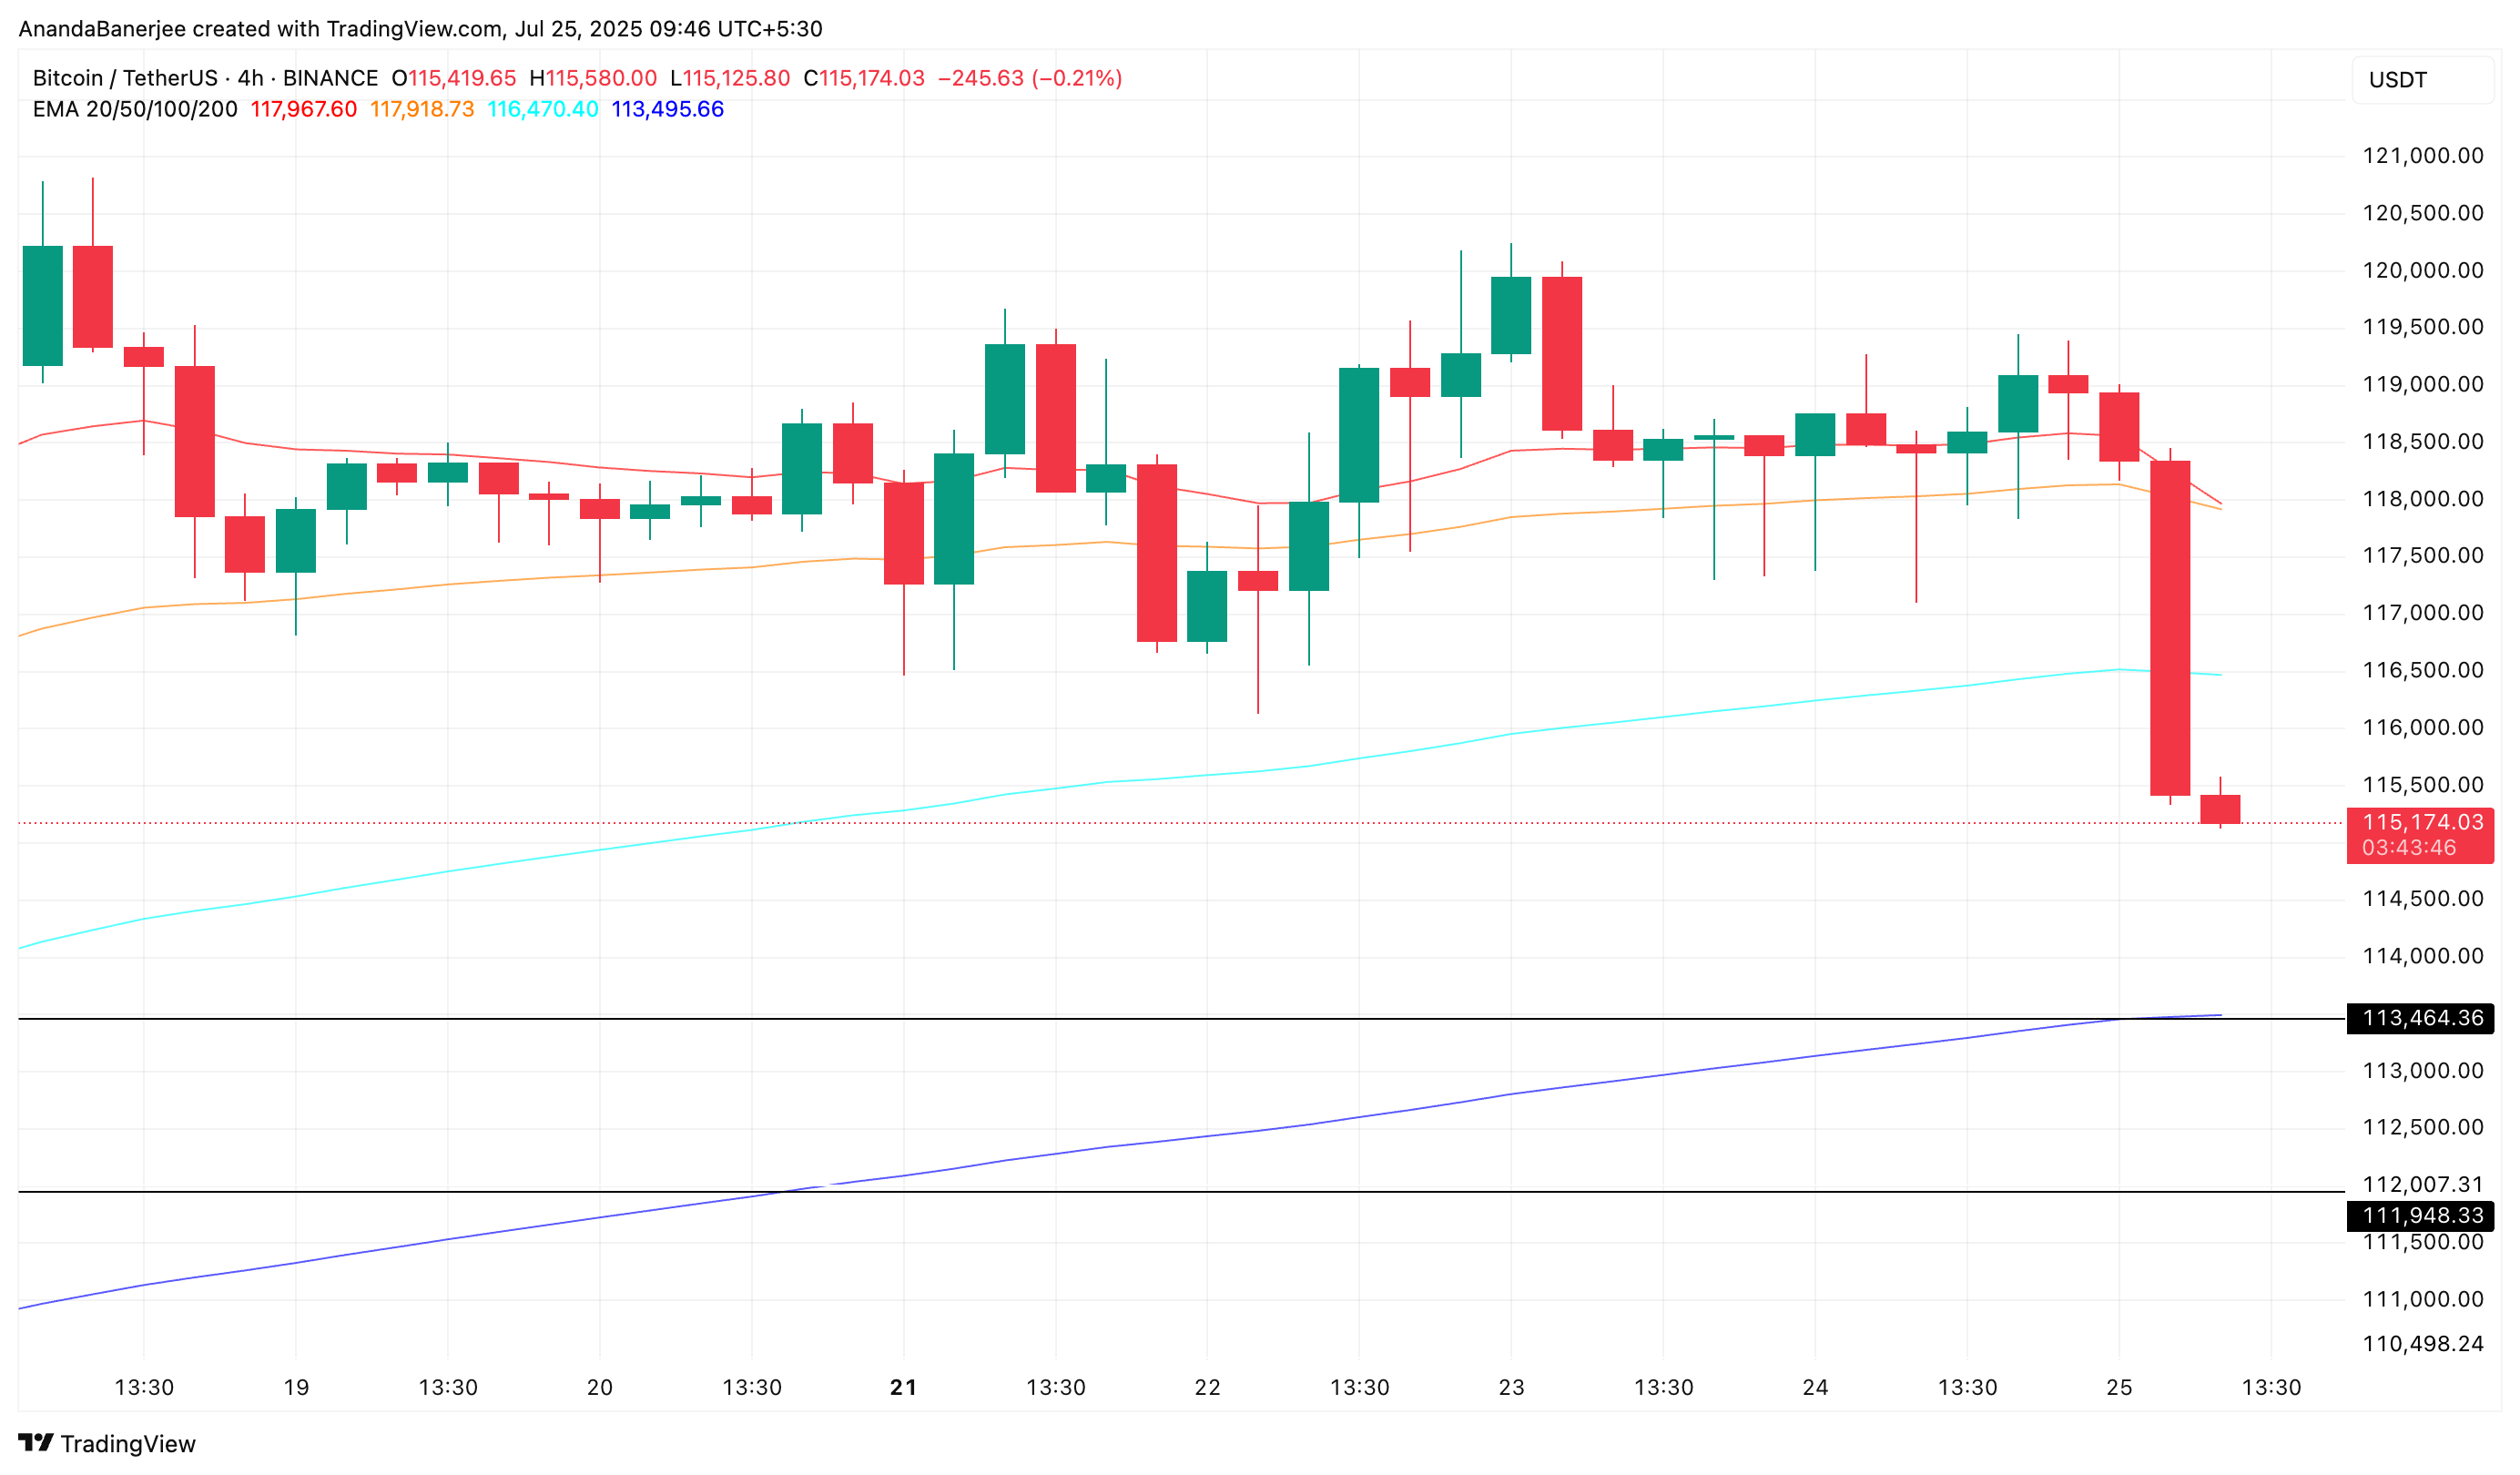
Why is this important? These EMA levels often serve as momentum signals for traders. A bearish cross between the 20 and 50 EMA typically confirms that short-term sellers have taken control.
This aligns with whale outflows and large players like Galaxy quietly reducing their positions.
The next major support line is the 200-period EMA (blue line) on the 4-hour chart, currently around $113,000. This EMA line also coincides with the key support level to be revealed in the next section.
Token TA and Market Update: Want more such token insights? Subscribe to editor Harsh Notariya's daily crypto newsletter here.
Bitcoin Price Chart, Defending $113,000
The daily Bitcoin price chart tells a similar story. BTC, which had been hovering near $117,000 for almost a week, has sharply declined and is currently around $115,000. If $113,000 is not defended, the next support levels are $110,000 and $107,000, marked by the 0.5 and 0.618 Fibonacci retracement levels.
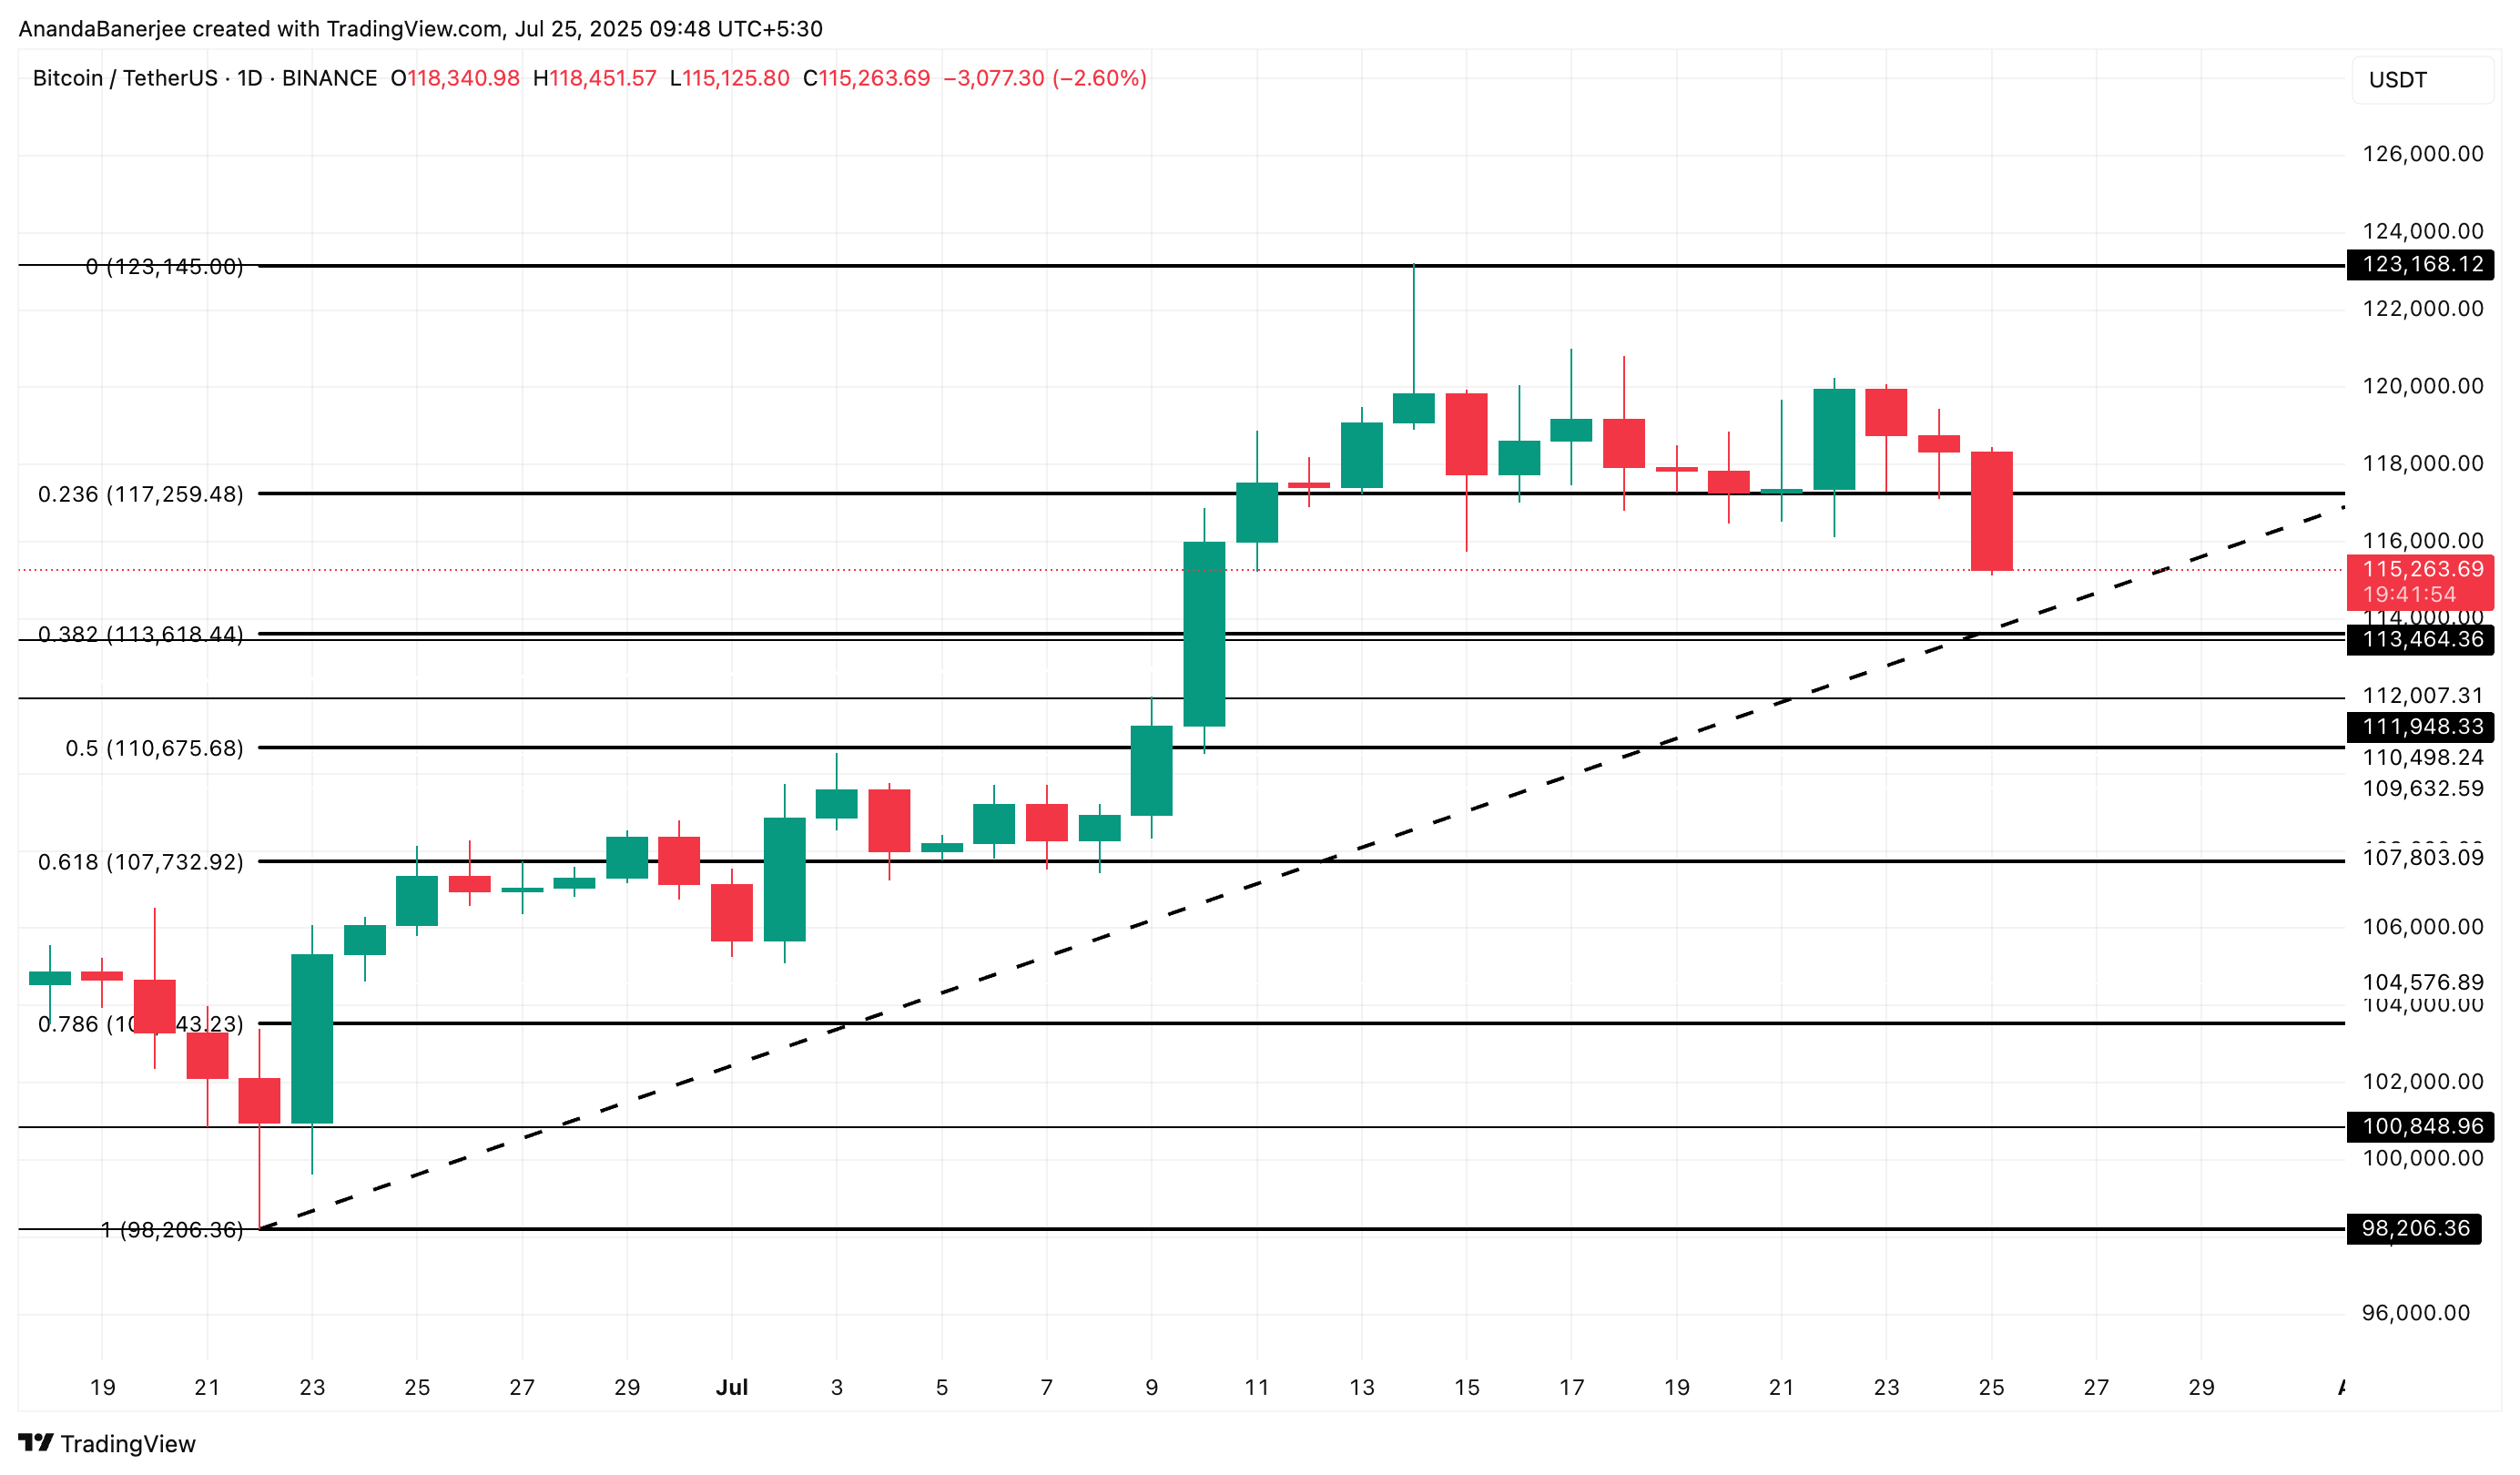
These are not just simple lines. They reflect broader trader sentiment. If the price falls below $113,000, BTC could face a deeper correction. Combined with the bearish EMA pattern and increasing whale-exchange activity, the risk of a Bitcoin plunge remains high.
However, if Bitcoin price can recover to $117,000 and near the previous all-time high of $123,000, the bearish structure could soon collapse. But for this to happen, big names in the Bitcoin space will need to return to the party.