

Shiba Inu is currently trading near $0.00001500, rising about 8% this week and over 30% this month, but still below the January peak of $0.000024.
The price continues to rise, but a band keeps reversing it. To determine if this movement can continue, it helps to know if holders are actually withdrawing cash and if momentum is truly forming.
SOPR, Deviating Below Weak Holder Break-Even Point
Profit-taking usually stops a rally, so the Spent Output Profit Ratio (SOPR) is important. SOPR shows whether coins sold on-chain are in profit (>1) or at a loss (<1).
Currently, SOPR has been below that line for several weeks, around 1.0. On April 30, SOPR dropped to about 0.72 when the price was near $0.00001327. Afterward, the price rose about 28% to near $0.00001700, and SOPR headed back to 1.0.
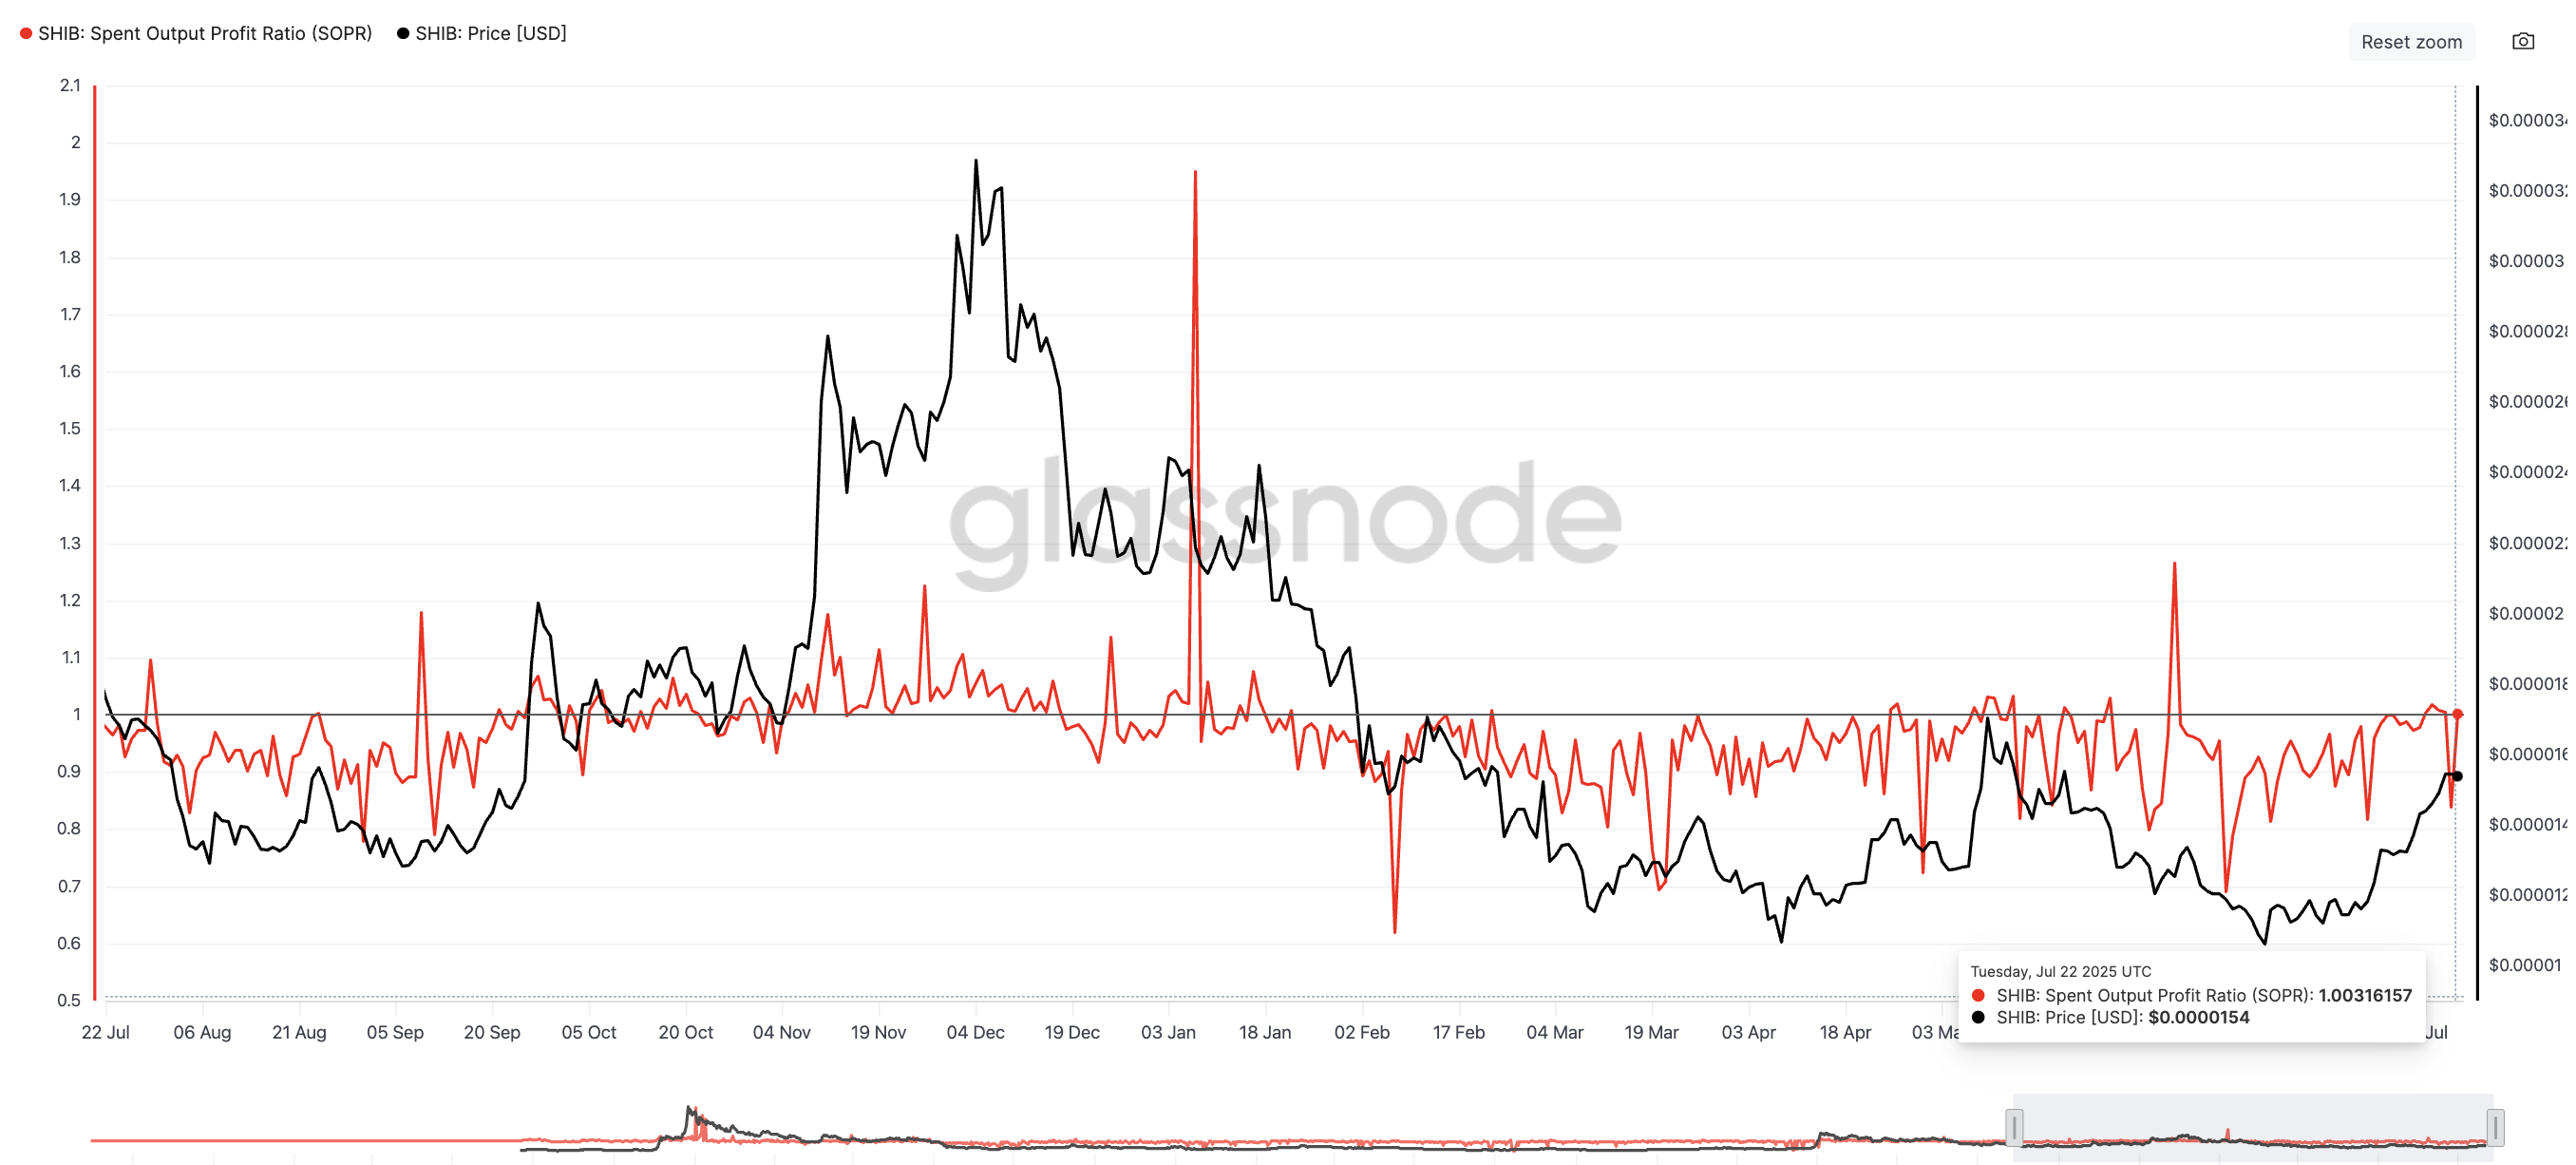
On June 16, SOPR dropped to about 0.69 when the price was near $0.00001188. The price subsequently rose about 30% to $0.00001546, and SOPR headed back to 1.0. SHIB's SOPR dropped to 0.83 two days ago. The corresponding price increase is still pending.
The data shows that spent coins are close to or at a loss point, with no significant profits. Despite the price increase, this suggests weak hands are quietly leaving, thinning the supply.
Historically, when SOPR clearly crosses 1.0 and the price stops, an actual correction begins. This has not happened yet.
RSI, Strengthening Buying Pressure
To sustain the movement, momentum is needed, so we check the Relative Strength Index (RSI).
RSI measures the strength of recent price movements on a 0-100 scale. Since mid-June, the daily RSI has created slightly higher peaks, while the price created lower peaks. This bullish divergence indicates momentum is improving faster than price.
While RSI divergence is minimal, it suggests increasing momentum, which is positive for Shiba Inu's price.
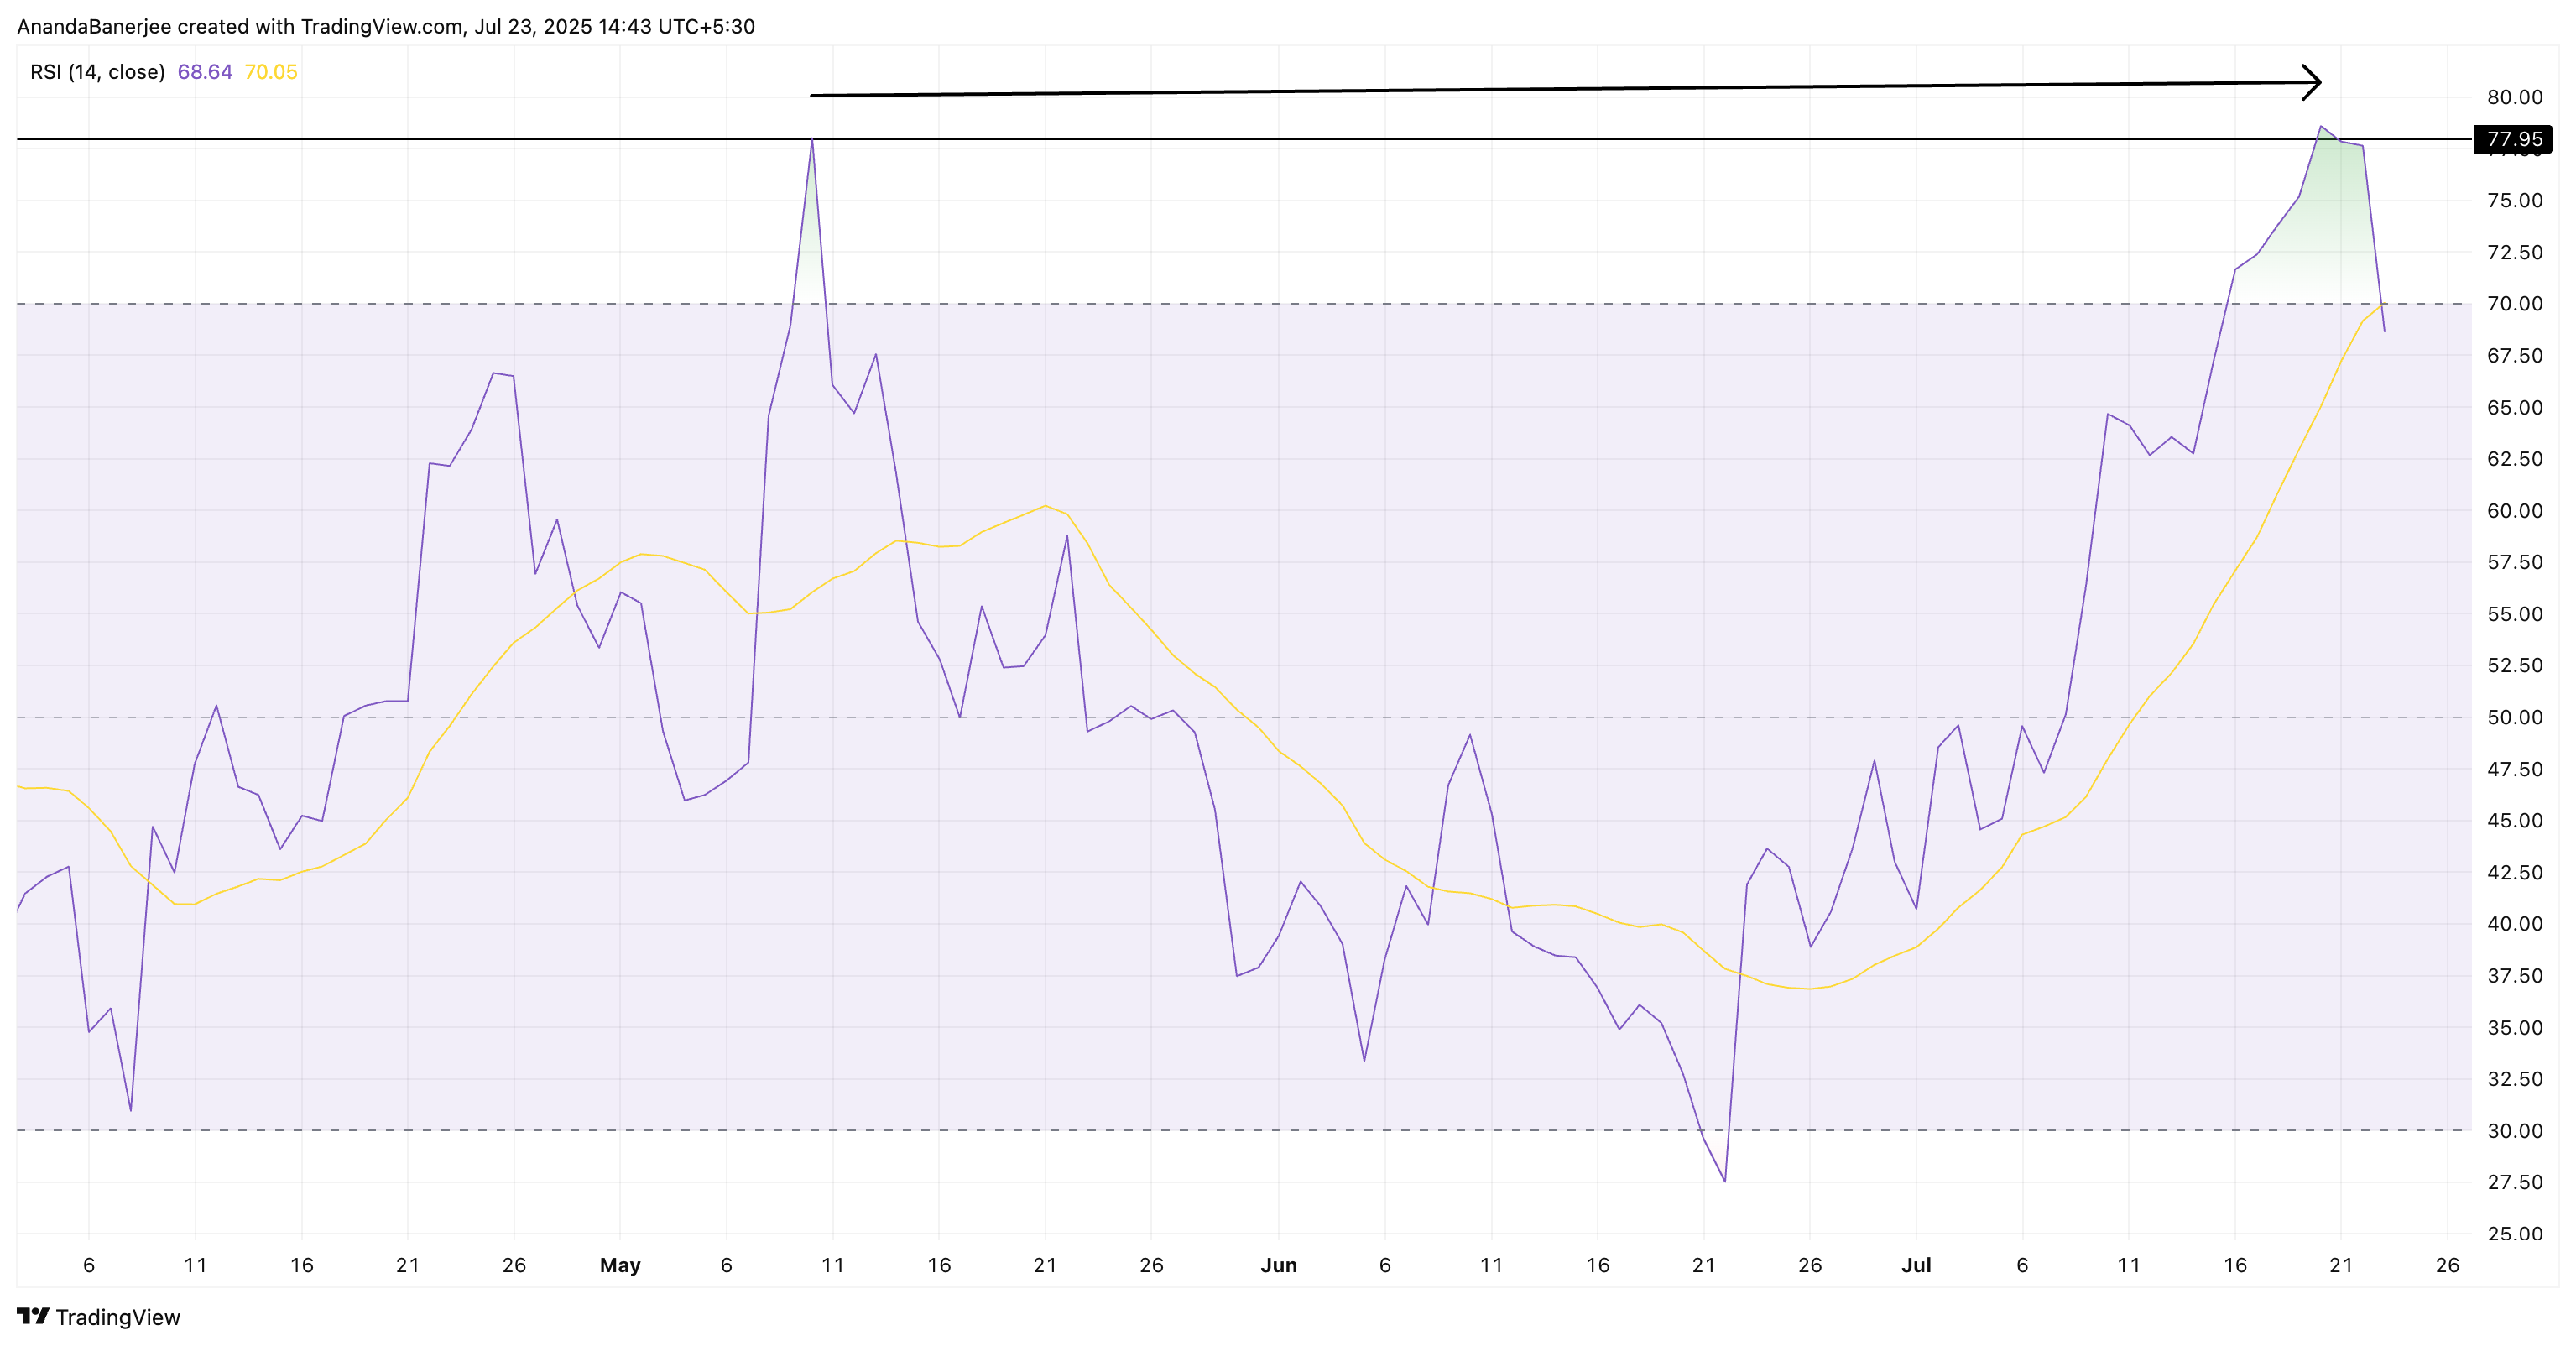
This means buyers are getting stronger despite the price not breaking through. If RSI continues to rise and price follows, the likelihood of a breakout increases. If RSI falls and price stalls, the movement might pause.
Token Technical Analysis and Market Update: Want more such token insights? Subscribe to the daily crypto newsletter by editor Harsh Notariya here.
Shiba Inu Price Level, Will 45% Target Open?
To confirm what indicators suggest, levels are needed. The key resistance is $0.00001587, a level that has rejected Shiba Inu (SHIB) price for some time.
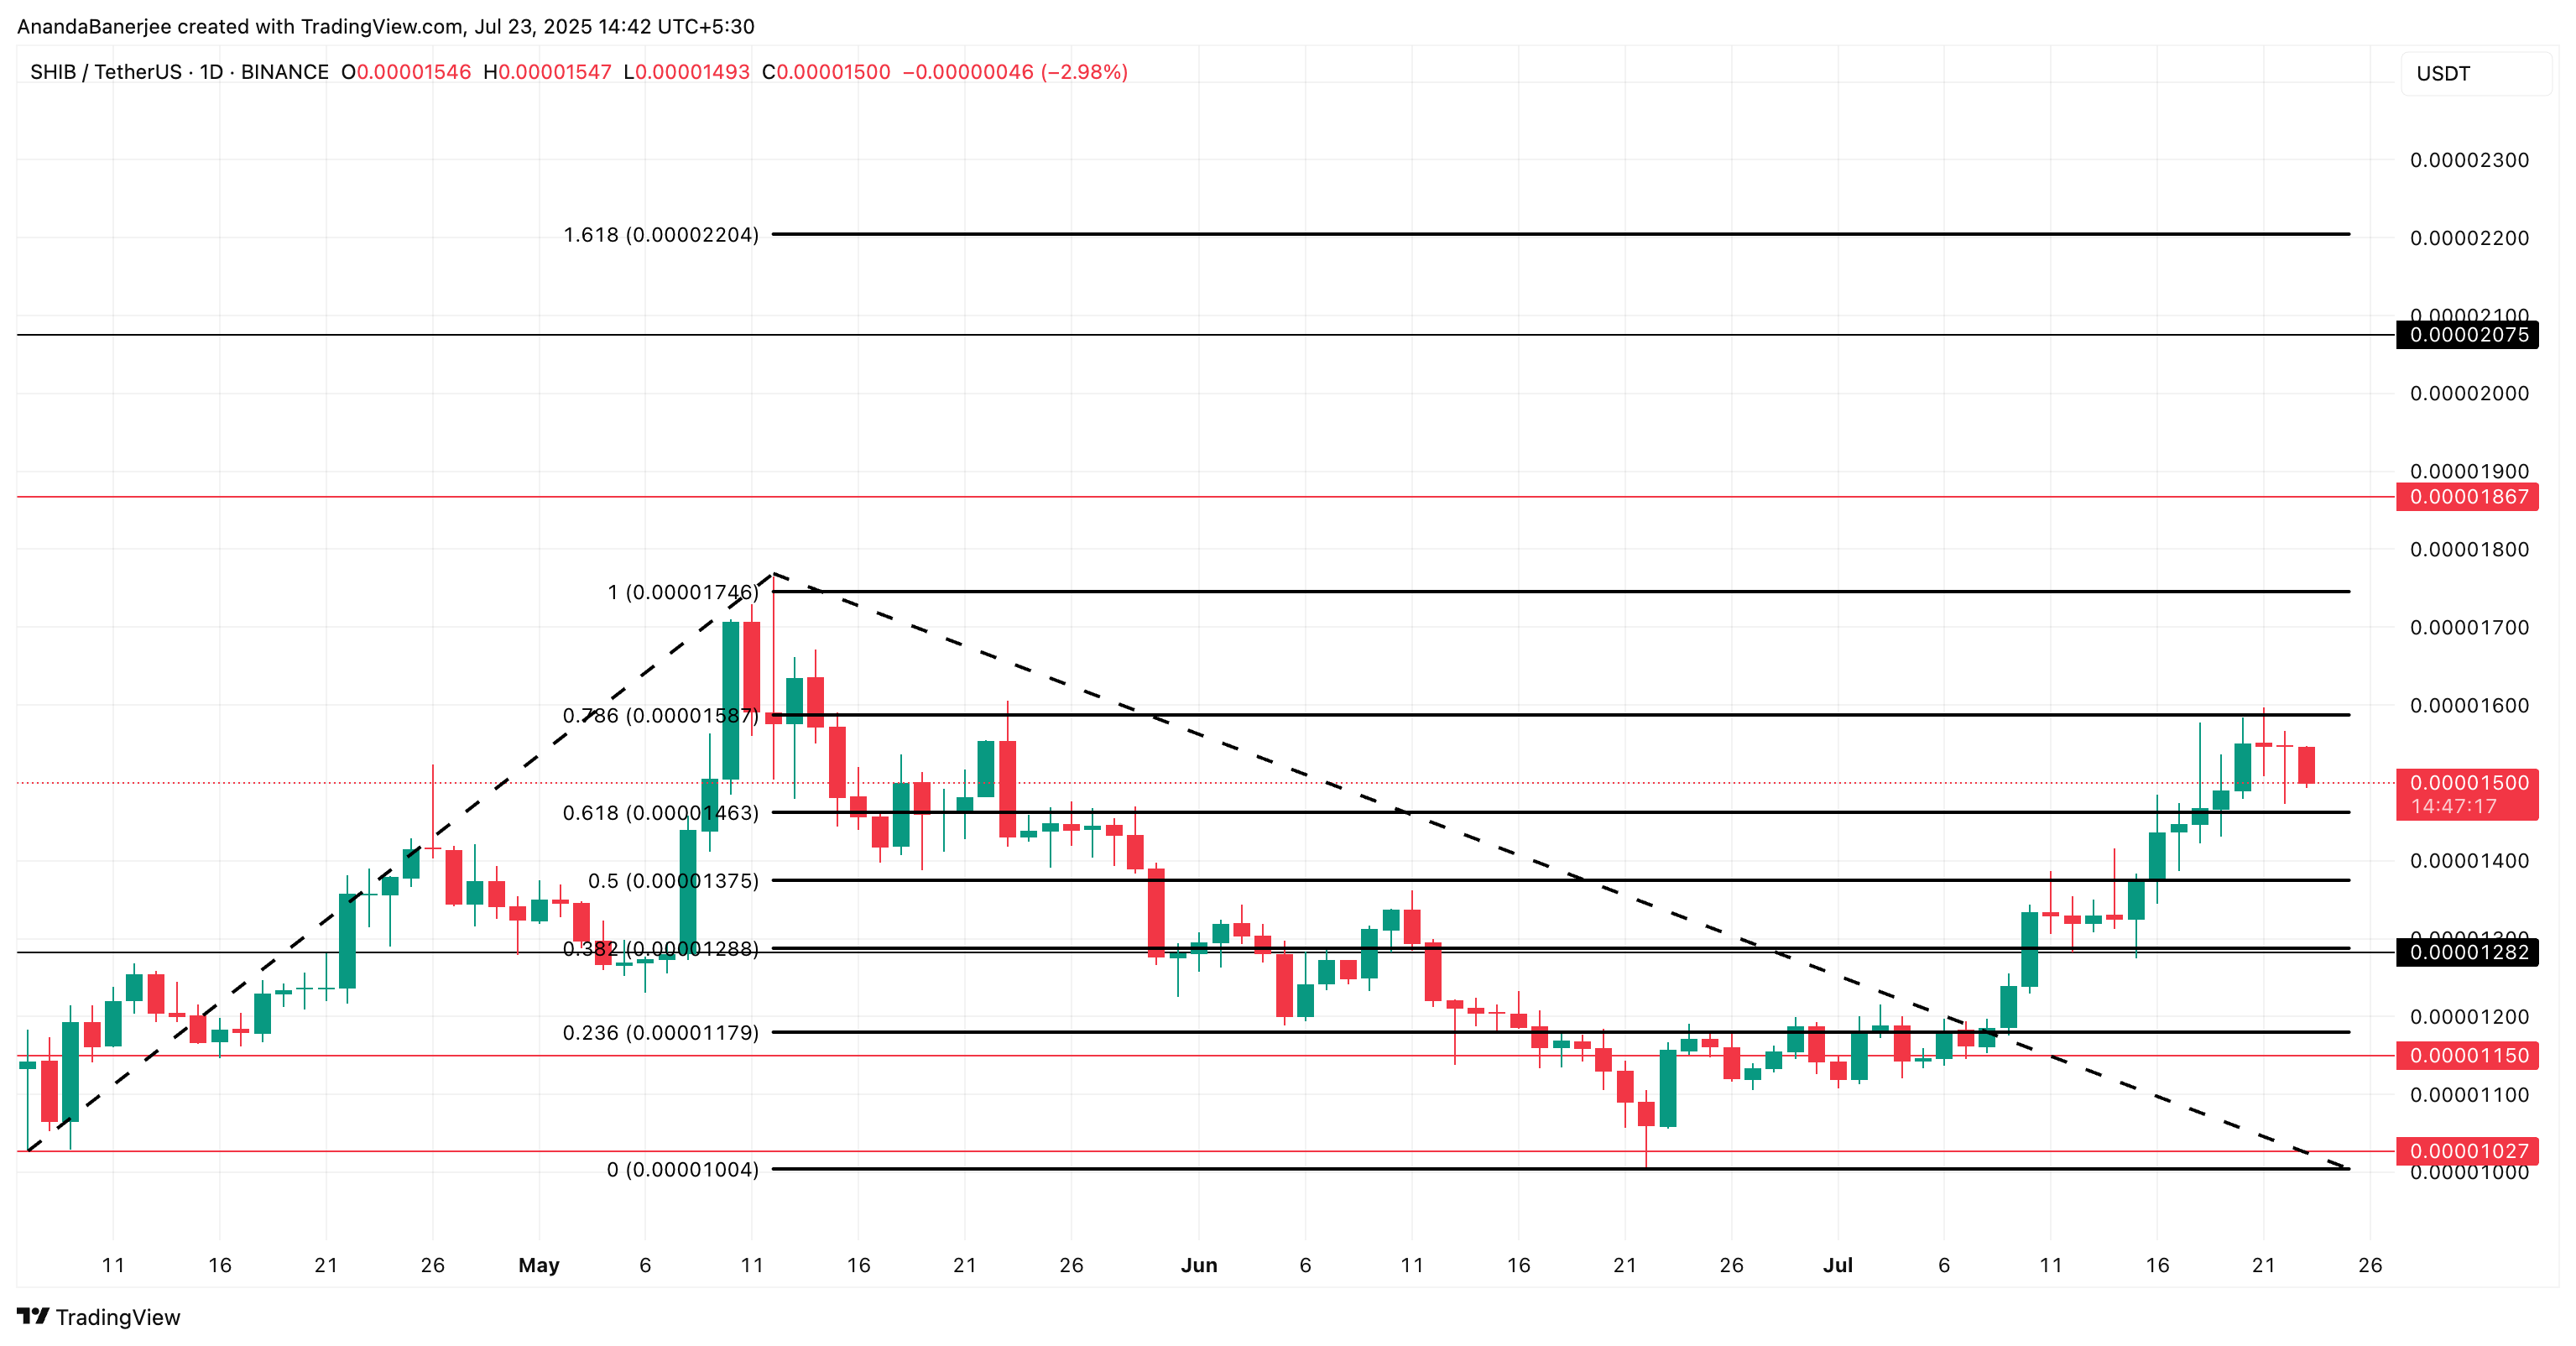
If the daily close exceeds $0.00001587, SHIB price could push to $0.00001746 (about 16% increase), and then to $0.000022 (about 45% increase). However, SHIB price must first cross the psychological resistance of $0.000020, which is a 33% increase from current levels. (Note: Many technical resistance levels do not exist if Shiba Inu price exceeds $0.00001746.)
On the downside, $0.00001463 is the first support level, followed by the 0.5 Fibonacci level at $0.00001375. If the price falls below these levels while SOPR crosses 1.0, the bullish outlook quickly weakens. This indicates profit-takers have finally intervened.
Fibonacci extension levels mark typical correction and target zones, so traders act accordingly.


