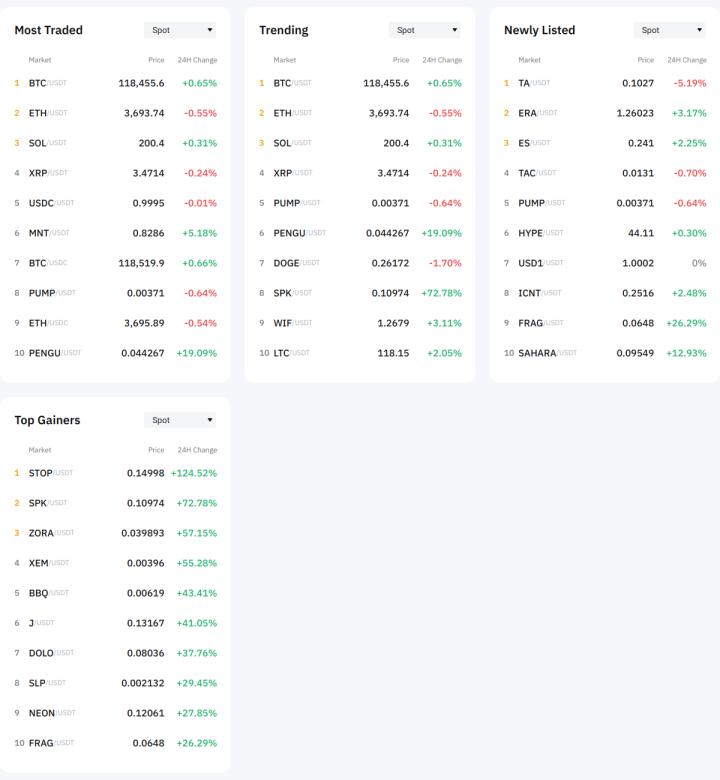
Spark (SPK) price surged over 90% in a day, reaching a new all-time high of $0.121 on July 23rd. The high interest in the Ignition Airdrop continues to drive the momentum, but the short-term chart demands a clearer upward movement before extending the price.
The current focus is on whether supply is returning to exchanges, if the momentum can actually surpass the last peak, and where the next support level lies. This is crucial for those tracking Spark price movements or the broader Spark token narrative.
Exchange Inflows, Profit-Taking Risk Realized
When tokens nearly double within 24 hours, the first question is: Are holders sending coins to exchanges to start selling? Thus, the hourly net inflow chart is important here.
SPK net inflows remained positive during the uptrend, meaning deposits exceeded withdrawals even as the price rose.
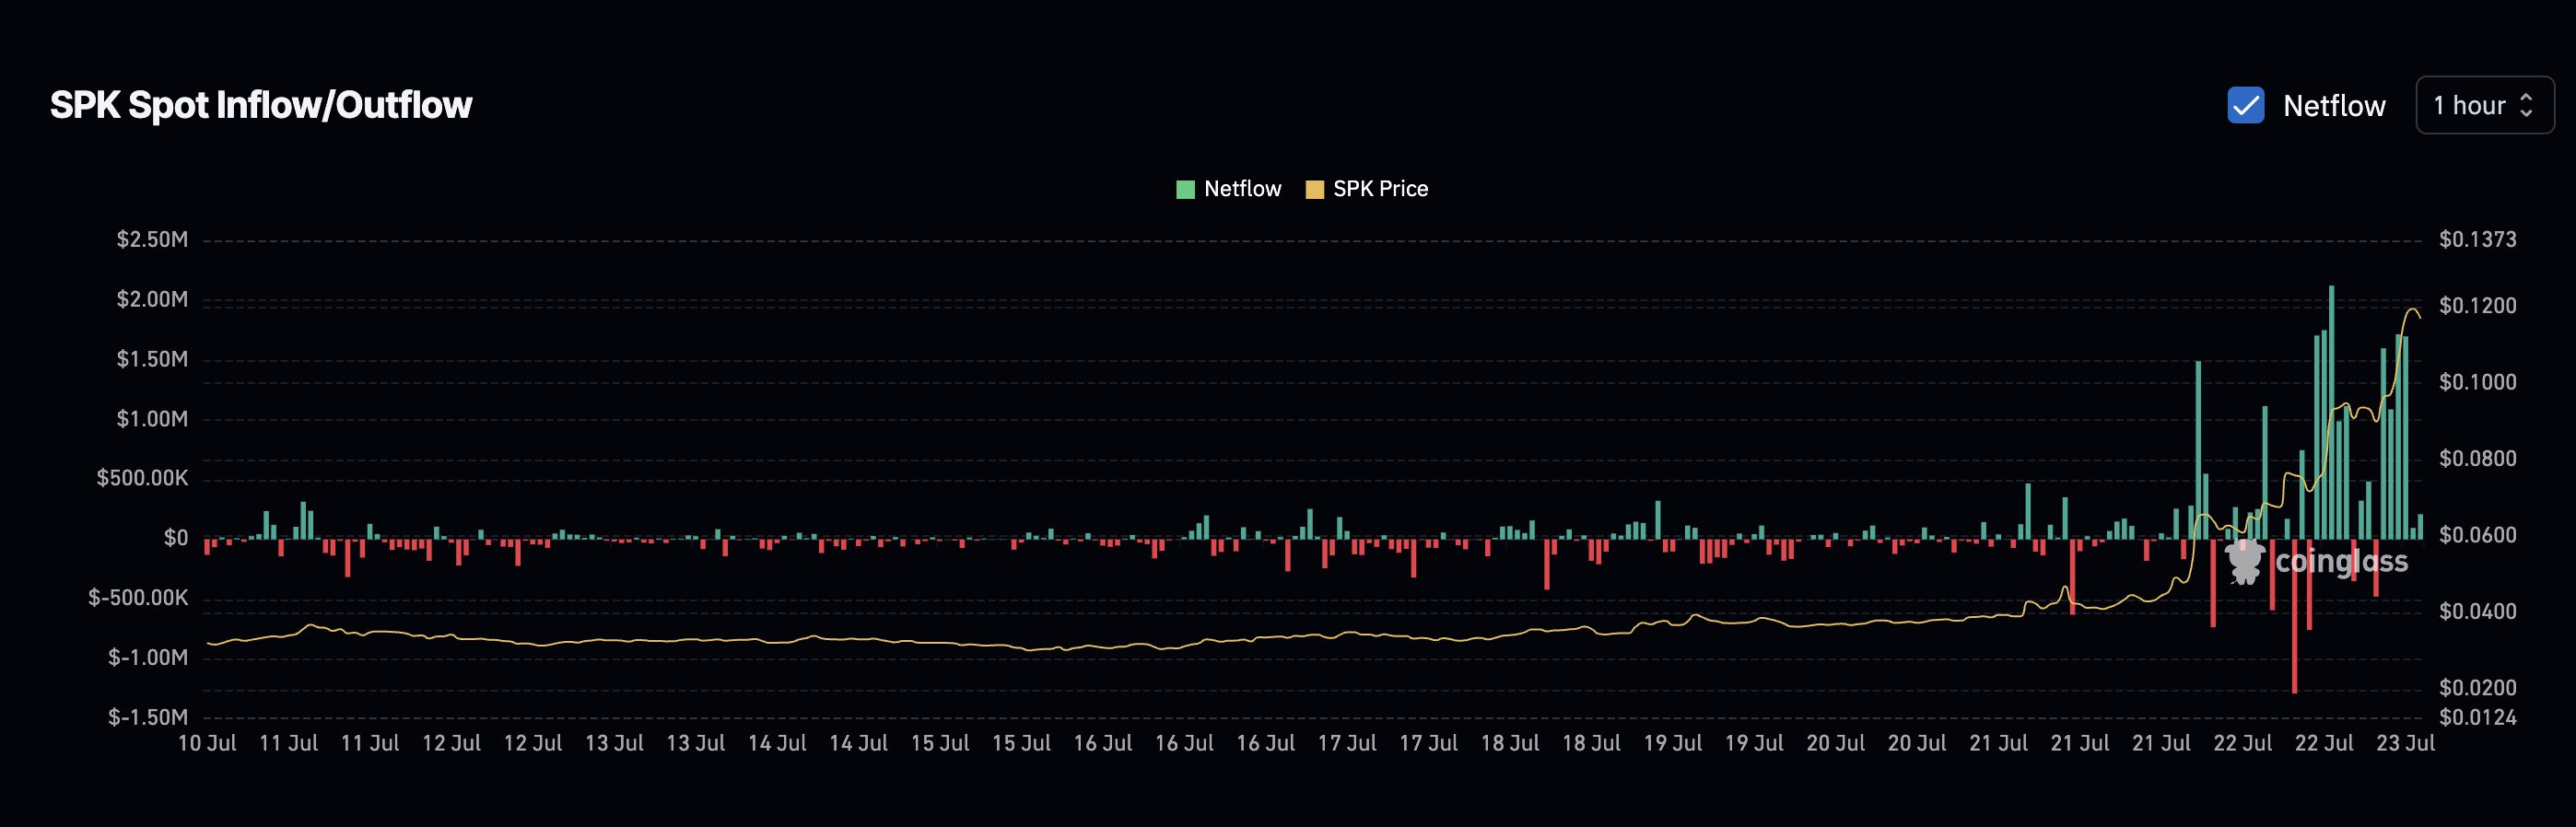
Since the price has already slightly declined, continued inflows could quickly turn additional coins on exchanges into sell orders.
Net inflows simply track token movement; persistent inflows during price stagnation suggest an imminent correction even within an uptrend.
RSI Must Lead to Sustain Breakout
We analyze the 1-hour Relative Strength Index (RSI). This movement was triggered by news, and momentum can change quickly at its scale. Additionally, the hourly perspective can help predict trends before moving to daily or 4-hour timelines.
Previously, between July 21st and 22nd, the RSI recorded higher highs as the price rose, with that alignment initiating a larger rally.
Currently, the Spark price is positioned at the top of a rising wedge, but the RSI remains near 80 without surpassing the last peak. The price range is the same, but momentum is weak.
Token Technical Analysis and Market Update: Want more such token insights? Subscribe to the daily crypto newsletter by editor Harsh Notariya here.
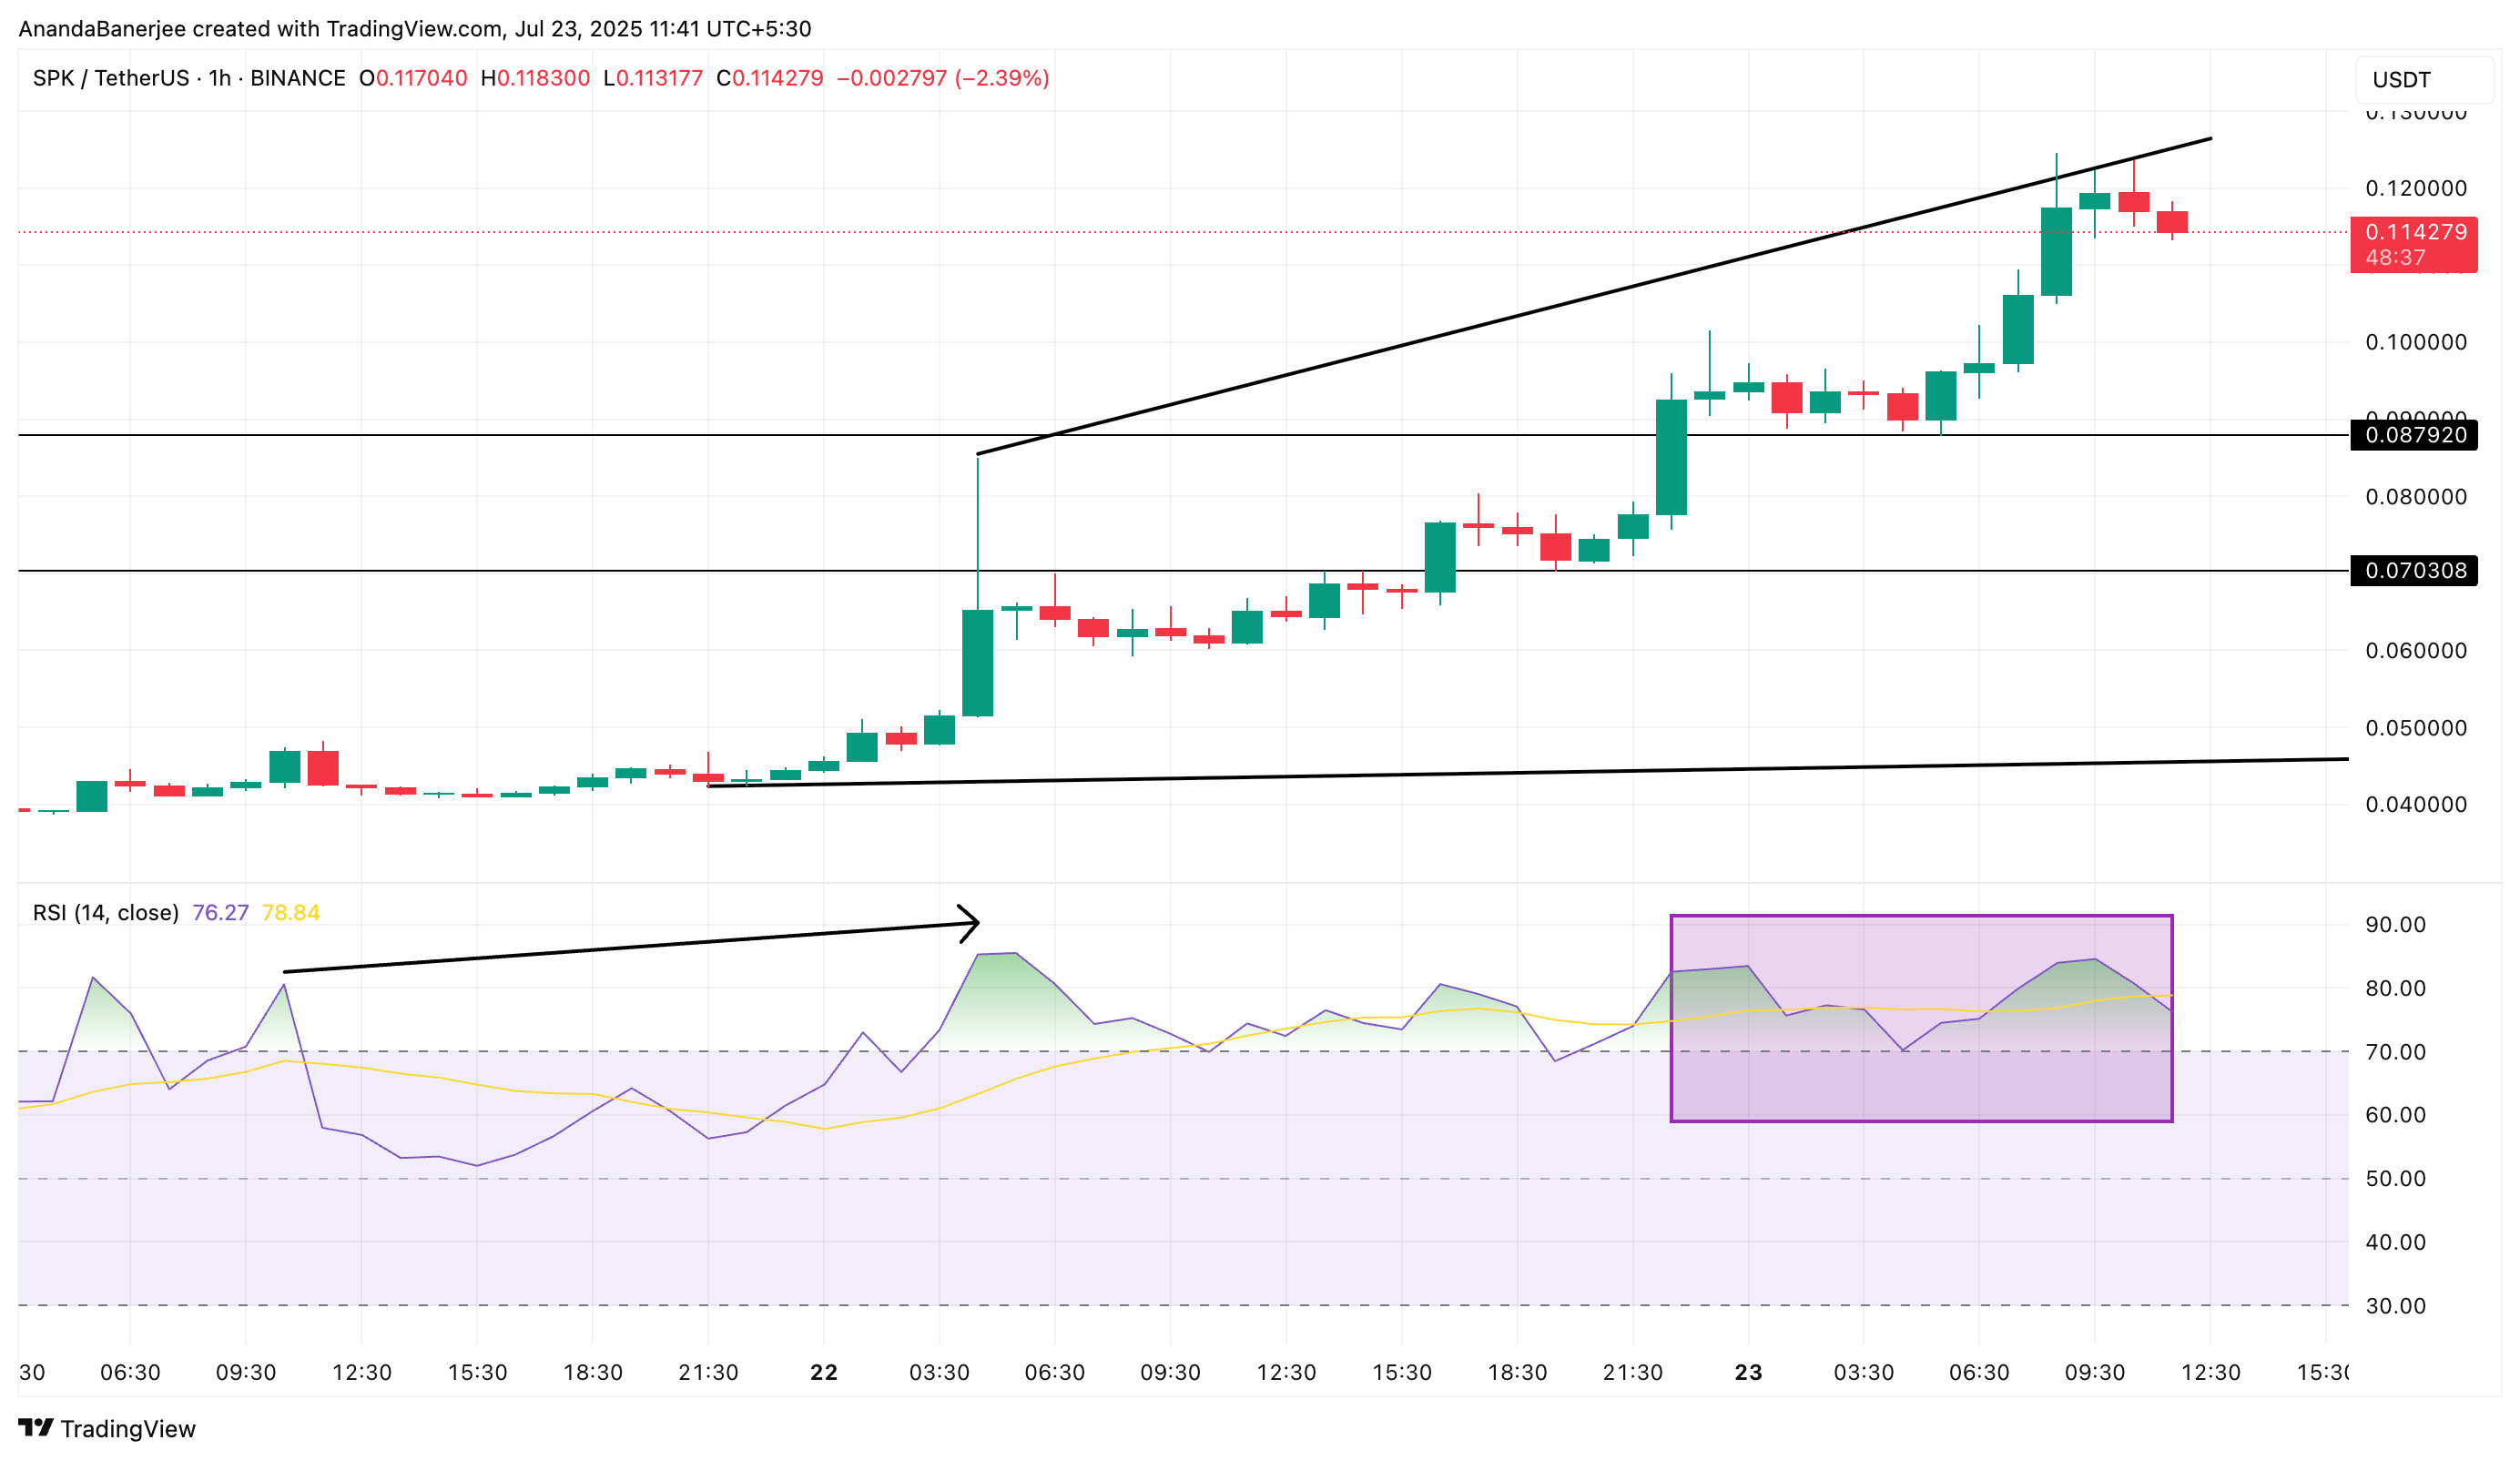
If the RSI fails to record higher highs with the price, the likelihood of a decline increases.
The Relative Strength Index (RSI) scores the intensity of recent movement from 0 to 100; if the price is flat or rising but the RSI is weak, momentum does not support the rise.
SPK Price Movement, $0.124 as Trigger
The top of that wedge almost perfectly aligns with the 0.618 mark of a trend-based Fibonacci extension near $0.124, providing a clear validation level for Spark token traders.
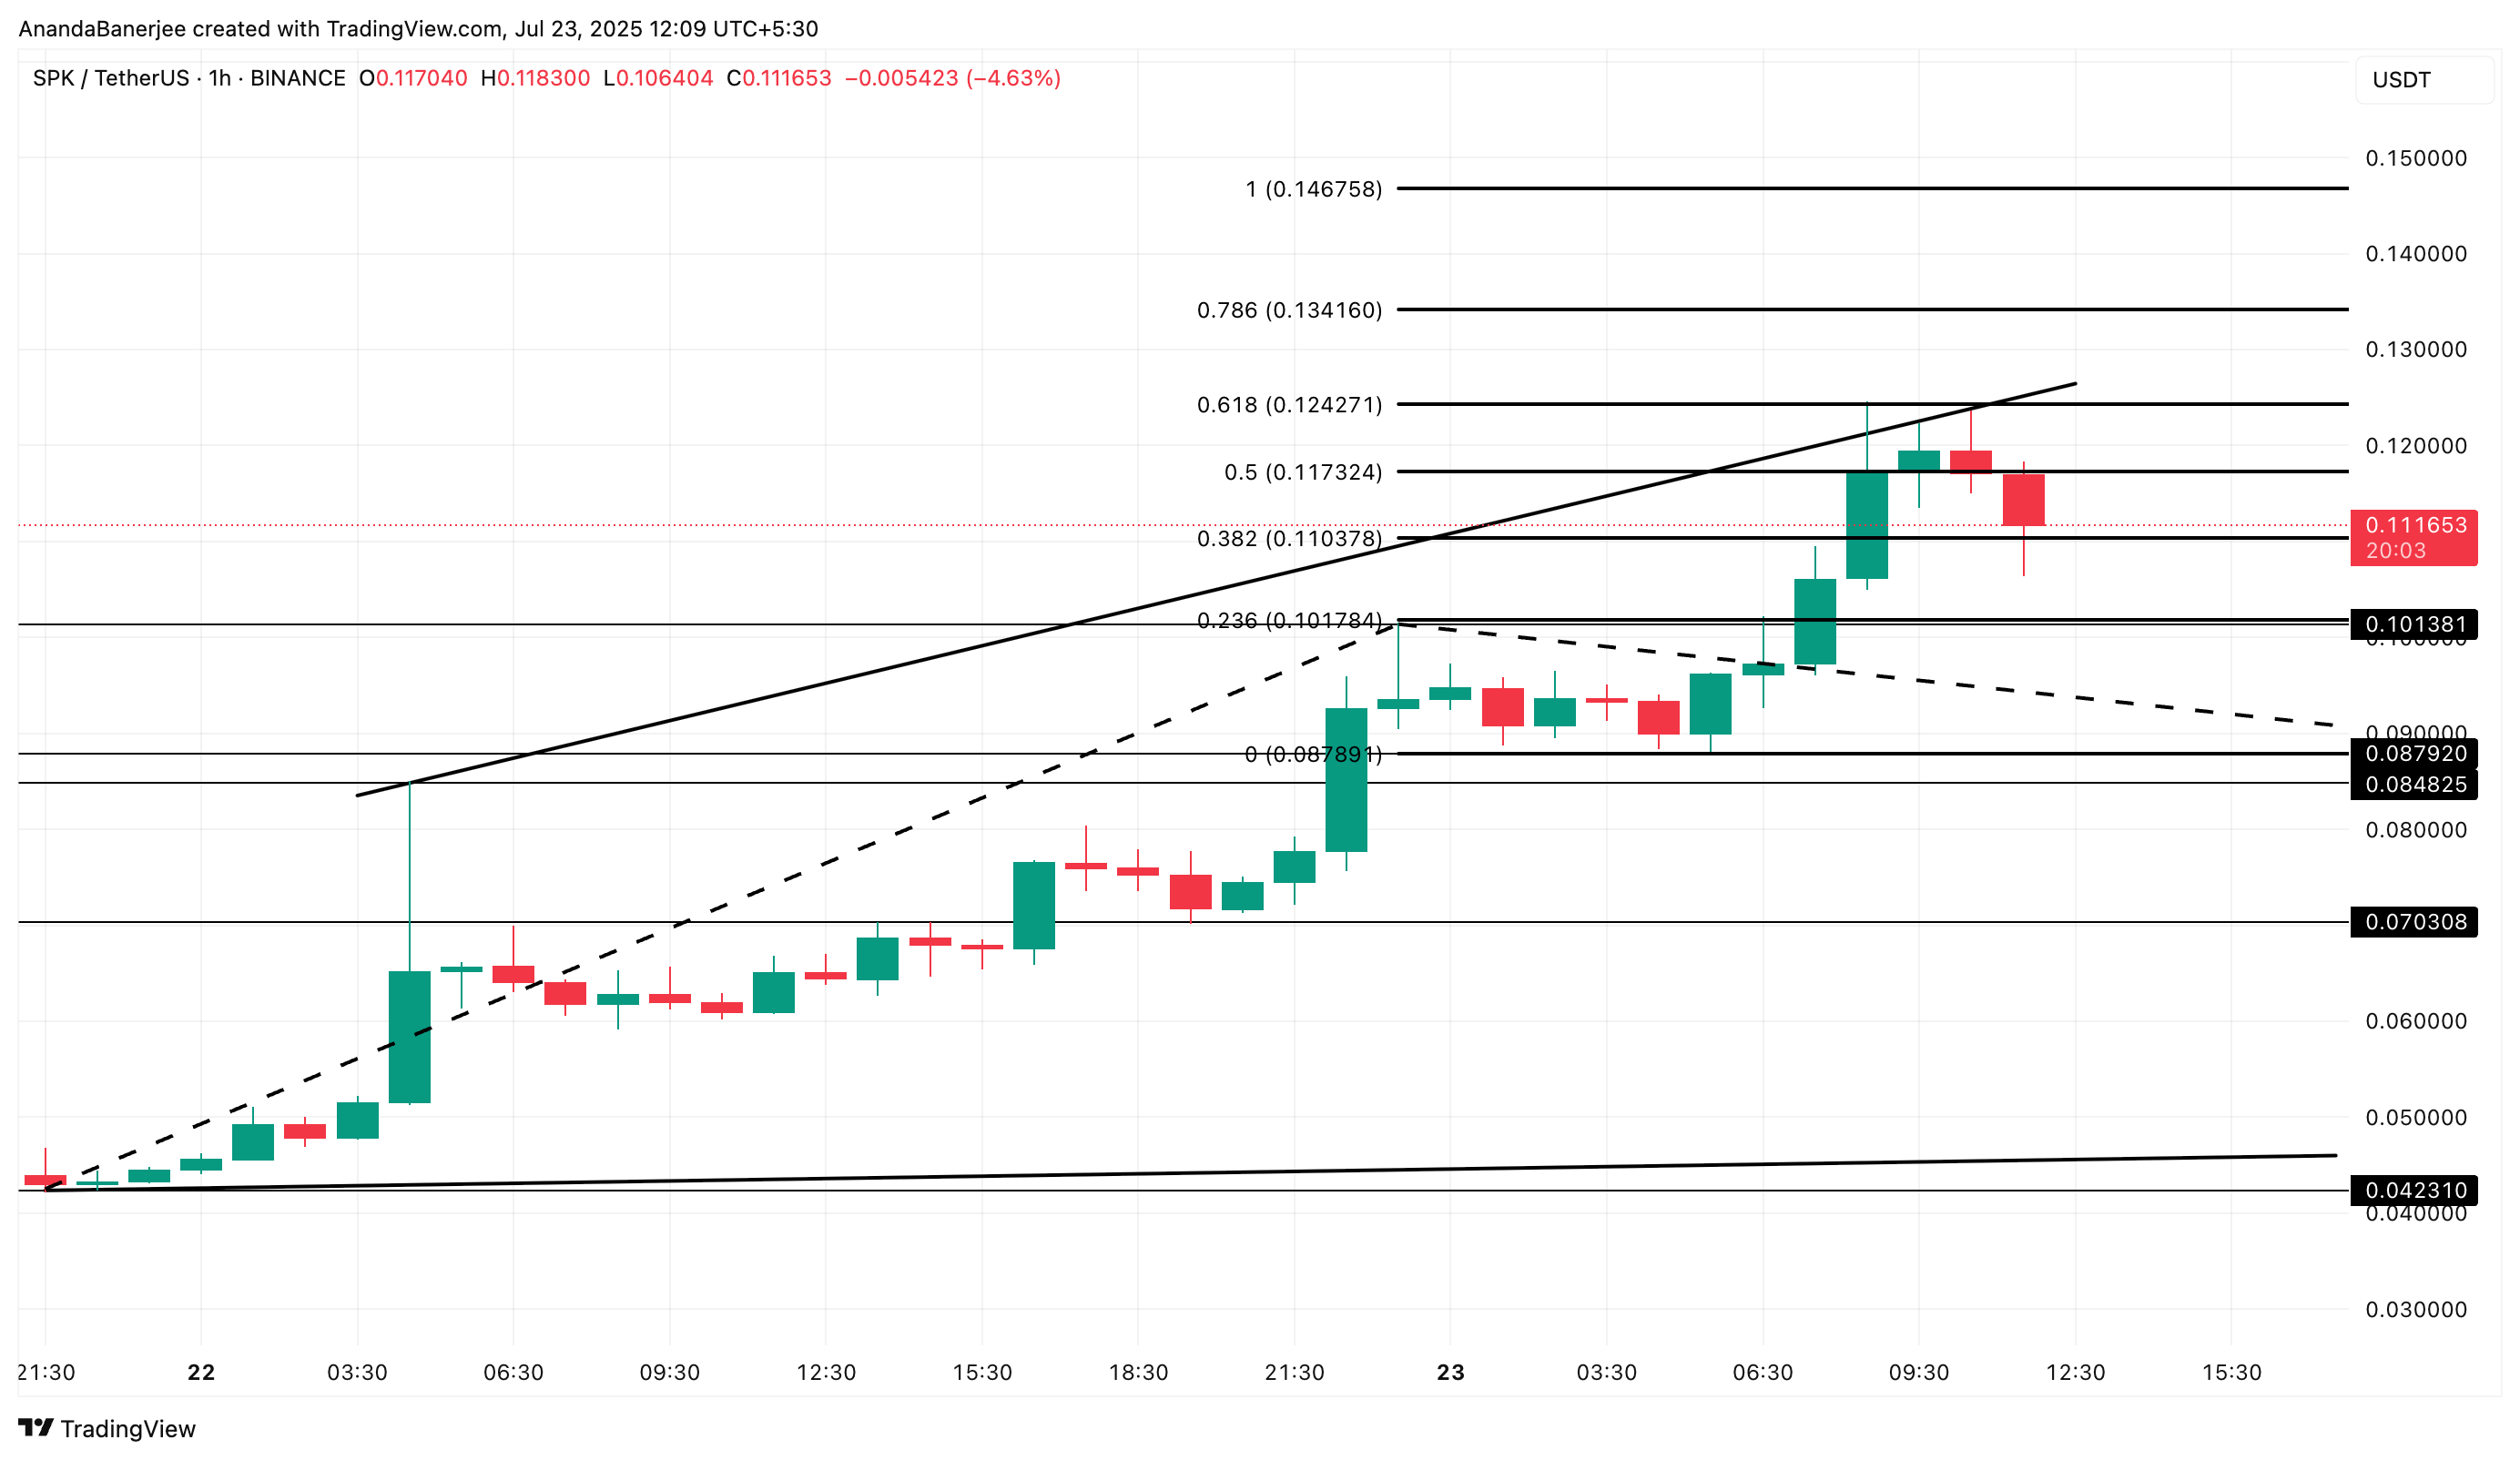
SPK has failed twice there. Already declining from $0.117 to around $0.111, $0.110 is the first level the bullish trend must defend.
Losing this could move the price to $0.101, the previous swing high used to fix the Fibonacci.
Below that is $0.087 (0 Fibonacci line). The broader bullish structure remains above that zone, but if SPK falls below, $0.070 will come into play and weaken the uptrend.
Conversely: If the RSI rises higher, hourly inflows calm down, and a clear hourly close above $0.124 is achieved, it opens the path for SPK price continuation and another all-time high.