As Bitcoin reached a new all-time high of $122,054, profit-taking was triggered across the market. On-chain data shows that institutional interest is cooling down.
After six weeks of net inflows into US-listed spot Bitcoin ETFs, this week saw outflows from several funds.
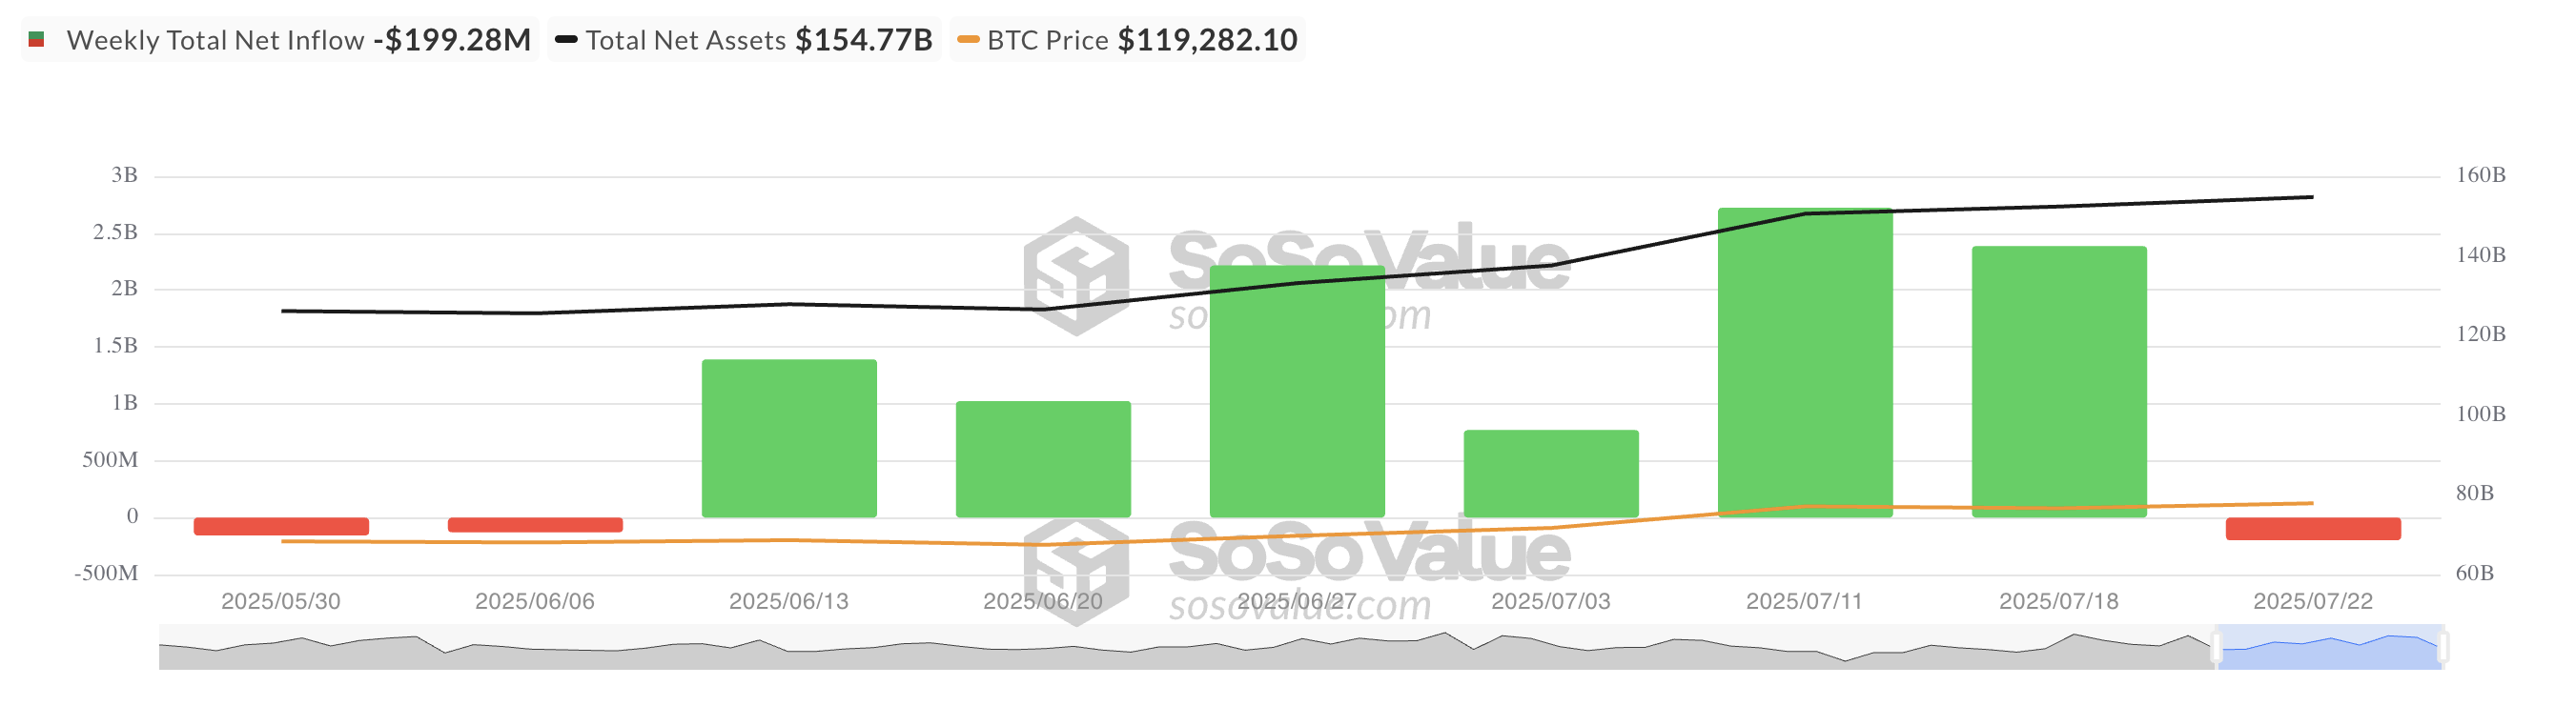
Institutional Investors Withdraw $199 Million from BTC ETF
According to SosoValue data, spot Bitcoin ETFs recorded total outflows of $199 million this week, reversing six weeks of net inflows. This change indicates a significant sentiment shift among institutional investors who had been steadily accumulating BTC exposure through ETFs during the recent rally.
Token TA and Market Update: Want more such token insights? Subscribe to editor Harsh Notariya's daily crypto newsletter here.
This adjustment occurred after the coin reached a new all-time high of $122,054 on July 14. Many investors who were watching for a decisive breakthrough above $120,000 seem to have seized the opportunity to close positions and realize profits.
ETF flows are widely considered a key indicator of institutional confidence. Particularly, a sharp decline in inflows after consistent accumulation suggests that institutional risk appetite is cooling down. This often means that even seasoned holders considered "diamond hands" are taking profits.
This does not necessarily indicate long-term bearishness but reflects an increase in short-term caution in the market.
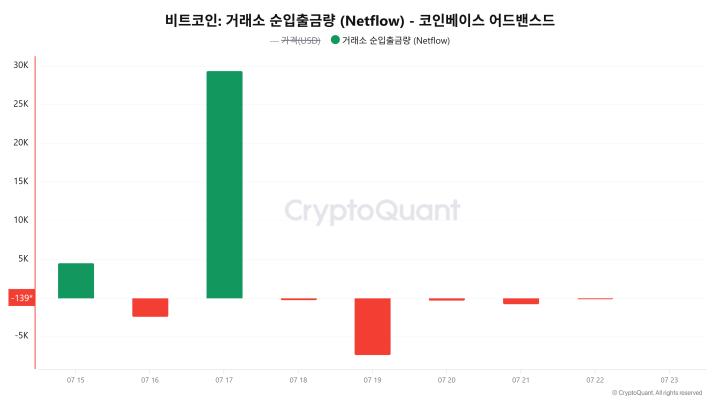
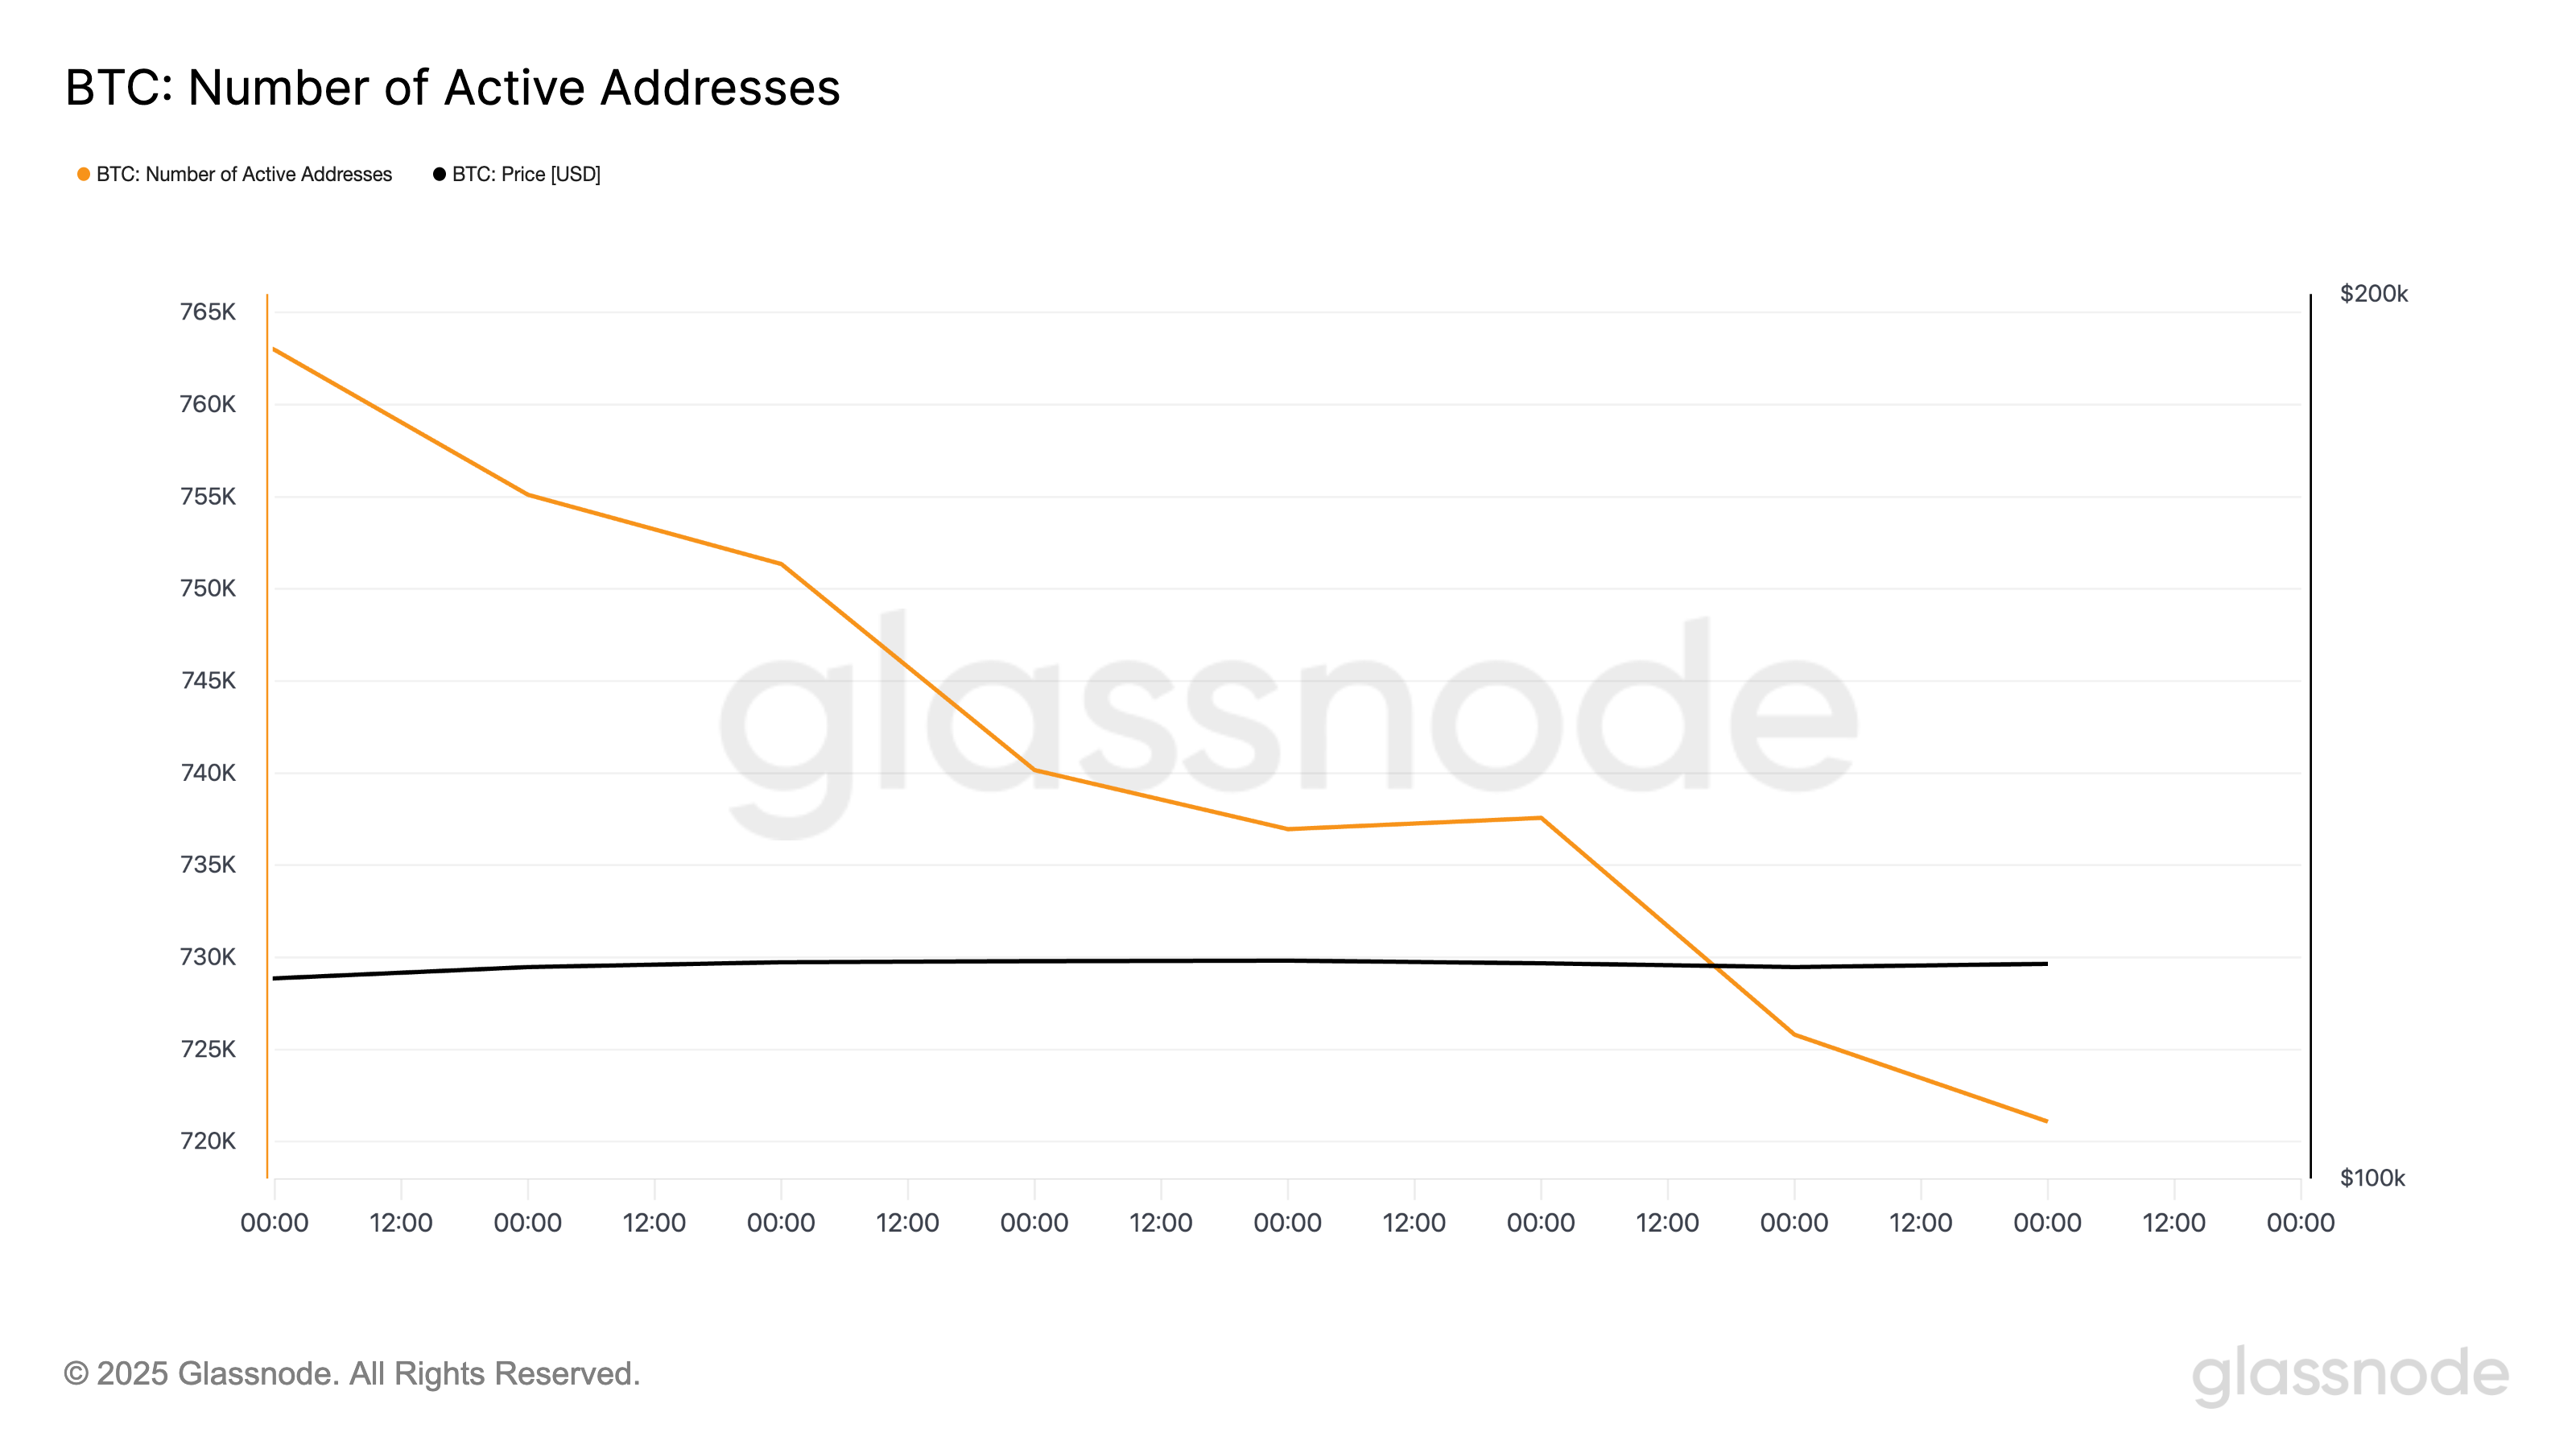
Additionally, glassnode data shows weakening on-chain activity, which could exacerbate the downside risk for BTC. According to the data provider, the number of active unique addresses on the Bitcoin network has gradually decreased over the past seven days, reaching a weekly low of 721,086 addresses yesterday.
As institutional capital retreats and retail activity simultaneously begins to slow down, this indicates a potential pause in the broader market, increasing the likelihood of a short-term BTC price correction.
BTC Aims to Break $120,000… Weakening Demand Threatens Decline
The BTC/USD daily chart shows it has mainly moved within a range since reaching an all-time high of $122,054 on July 14. Currently facing resistance at $120,811, with support formed at $116,952.
As demand decreases, the coin risks testing this support level. If BTC fails to maintain it, it risks dropping to $114,354.
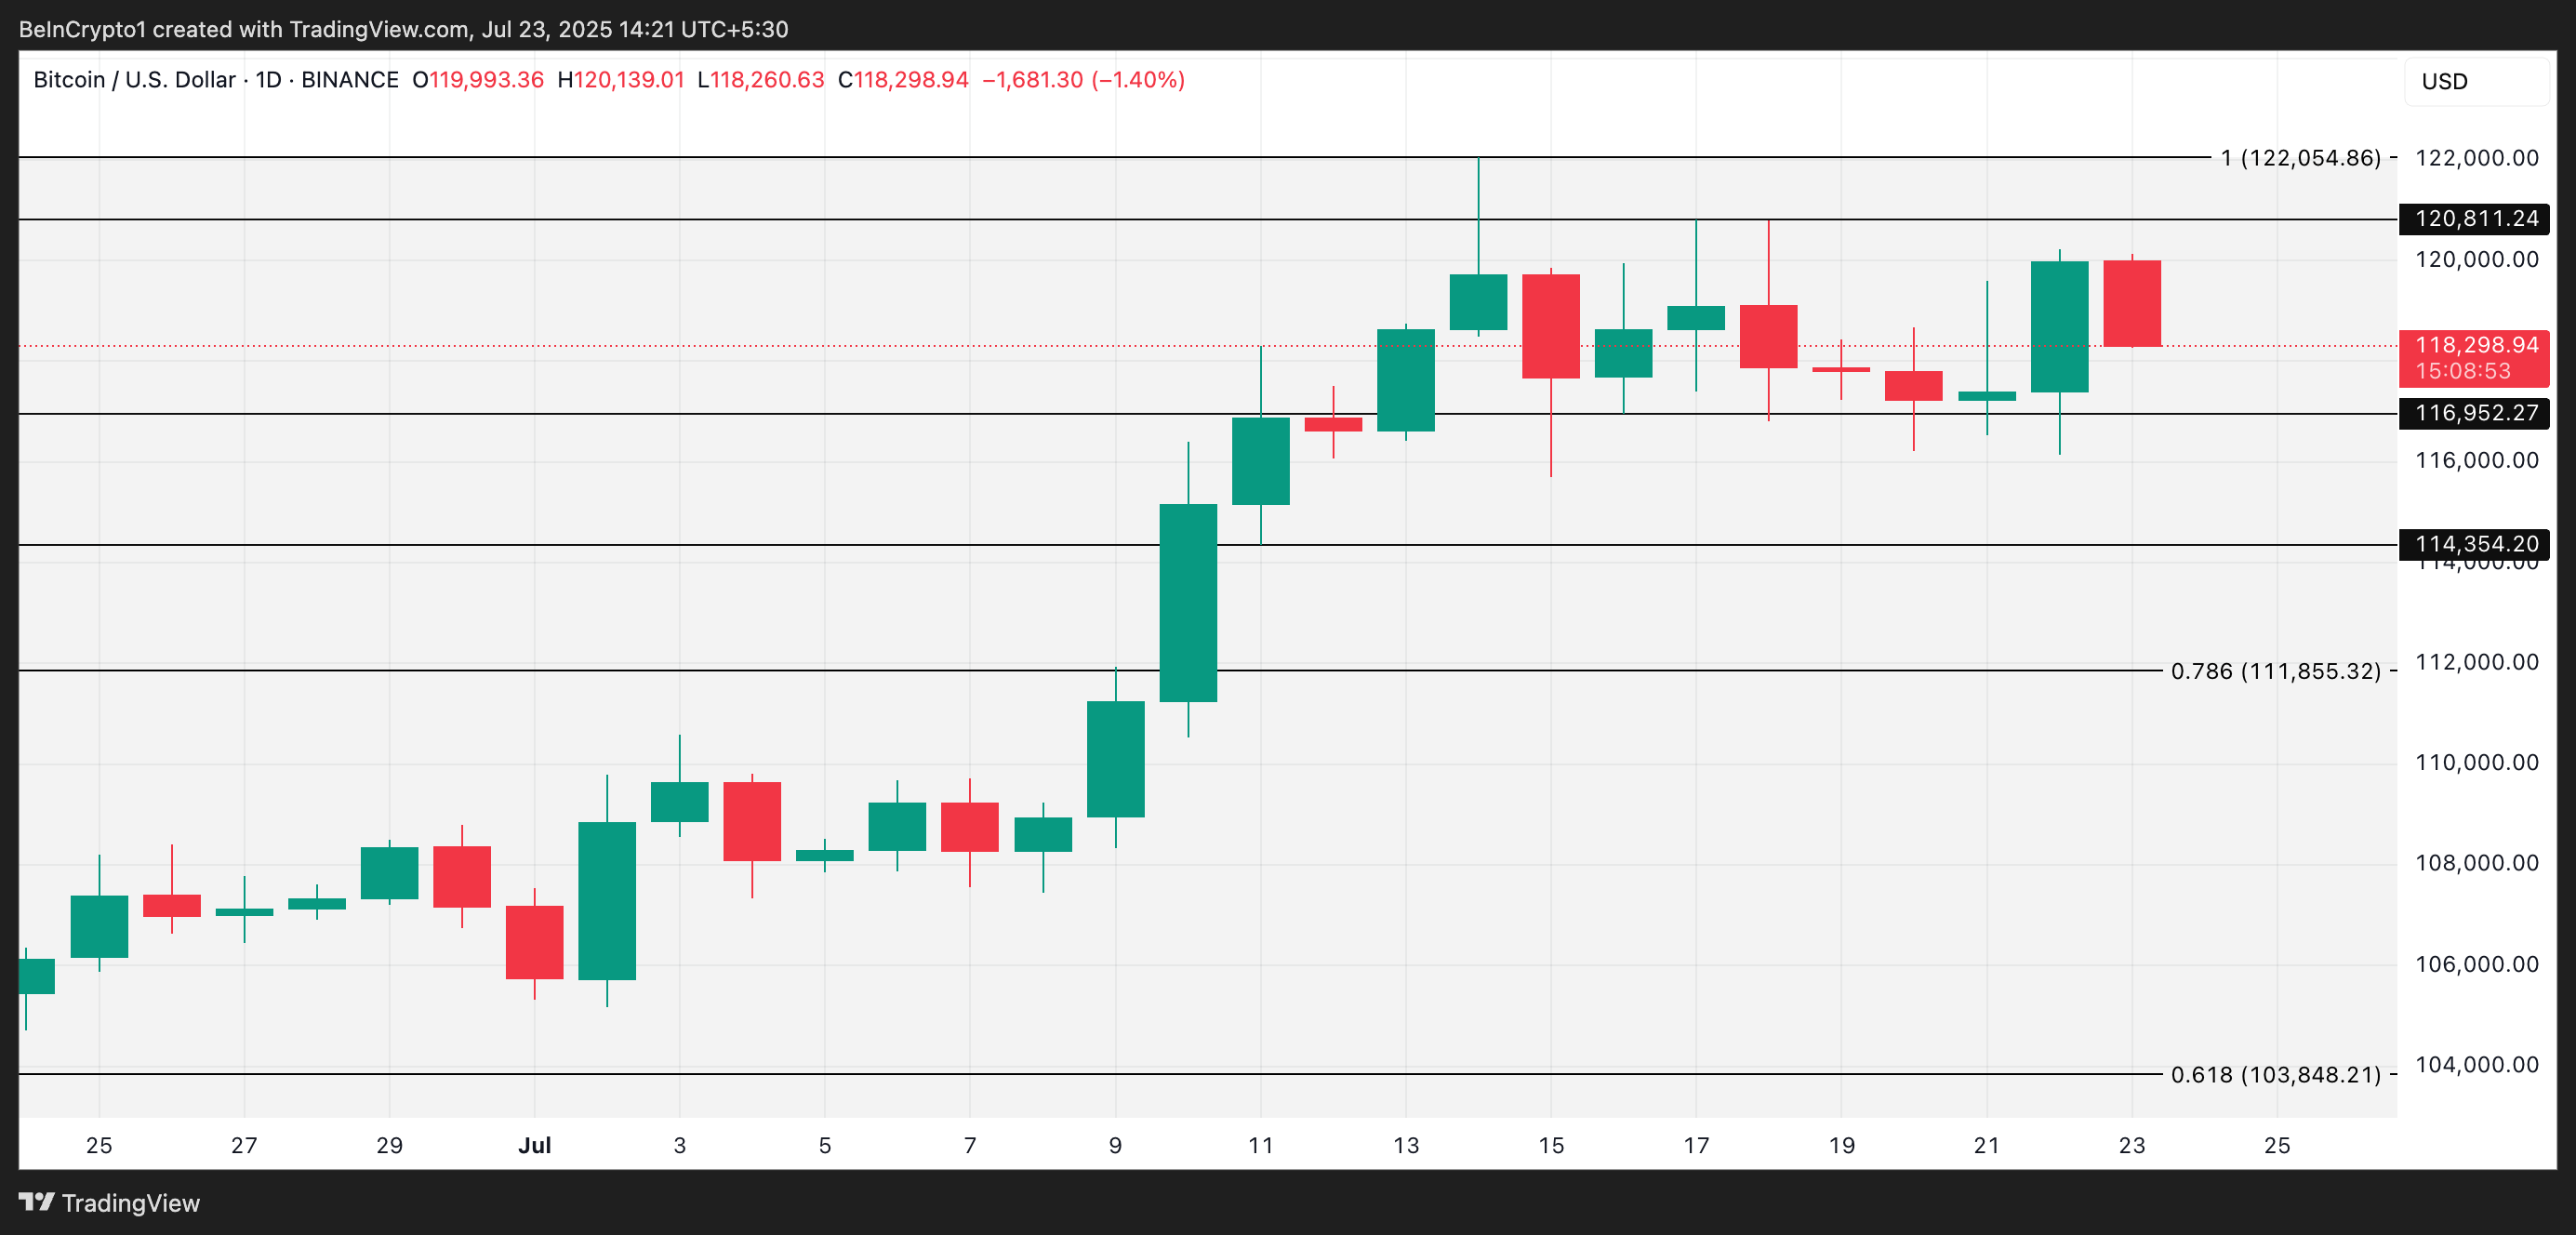
However, if new demand enters the market, the coin may attempt to break through the $120,811 barrier and recover its all-time high.