Bitcoin price is hovering above $117,500, but potential correction signs are increasing beneath the surface.
Longing holder and whale activity on-chain signals are aligning with key price action levels. Referencing history, such alignment could trigger a healthy correction within the next few days.
Longing Holder SOPR, Quiet Exit Signal
The Spent Output Profit Ratio (SOPR) for BTC holders who have held for over 155 days shows signs of consistent profit realization. As of July 21, the longing SOPR is 1.96, meaning these holders are selling coins at nearly twice their acquisition cost.
The number alone might not be a warning, but context tells the story.
Token TA and Market Update: Want more such token insights? Subscribe to editor Harshi Notariya's daily crypto newsletter here.
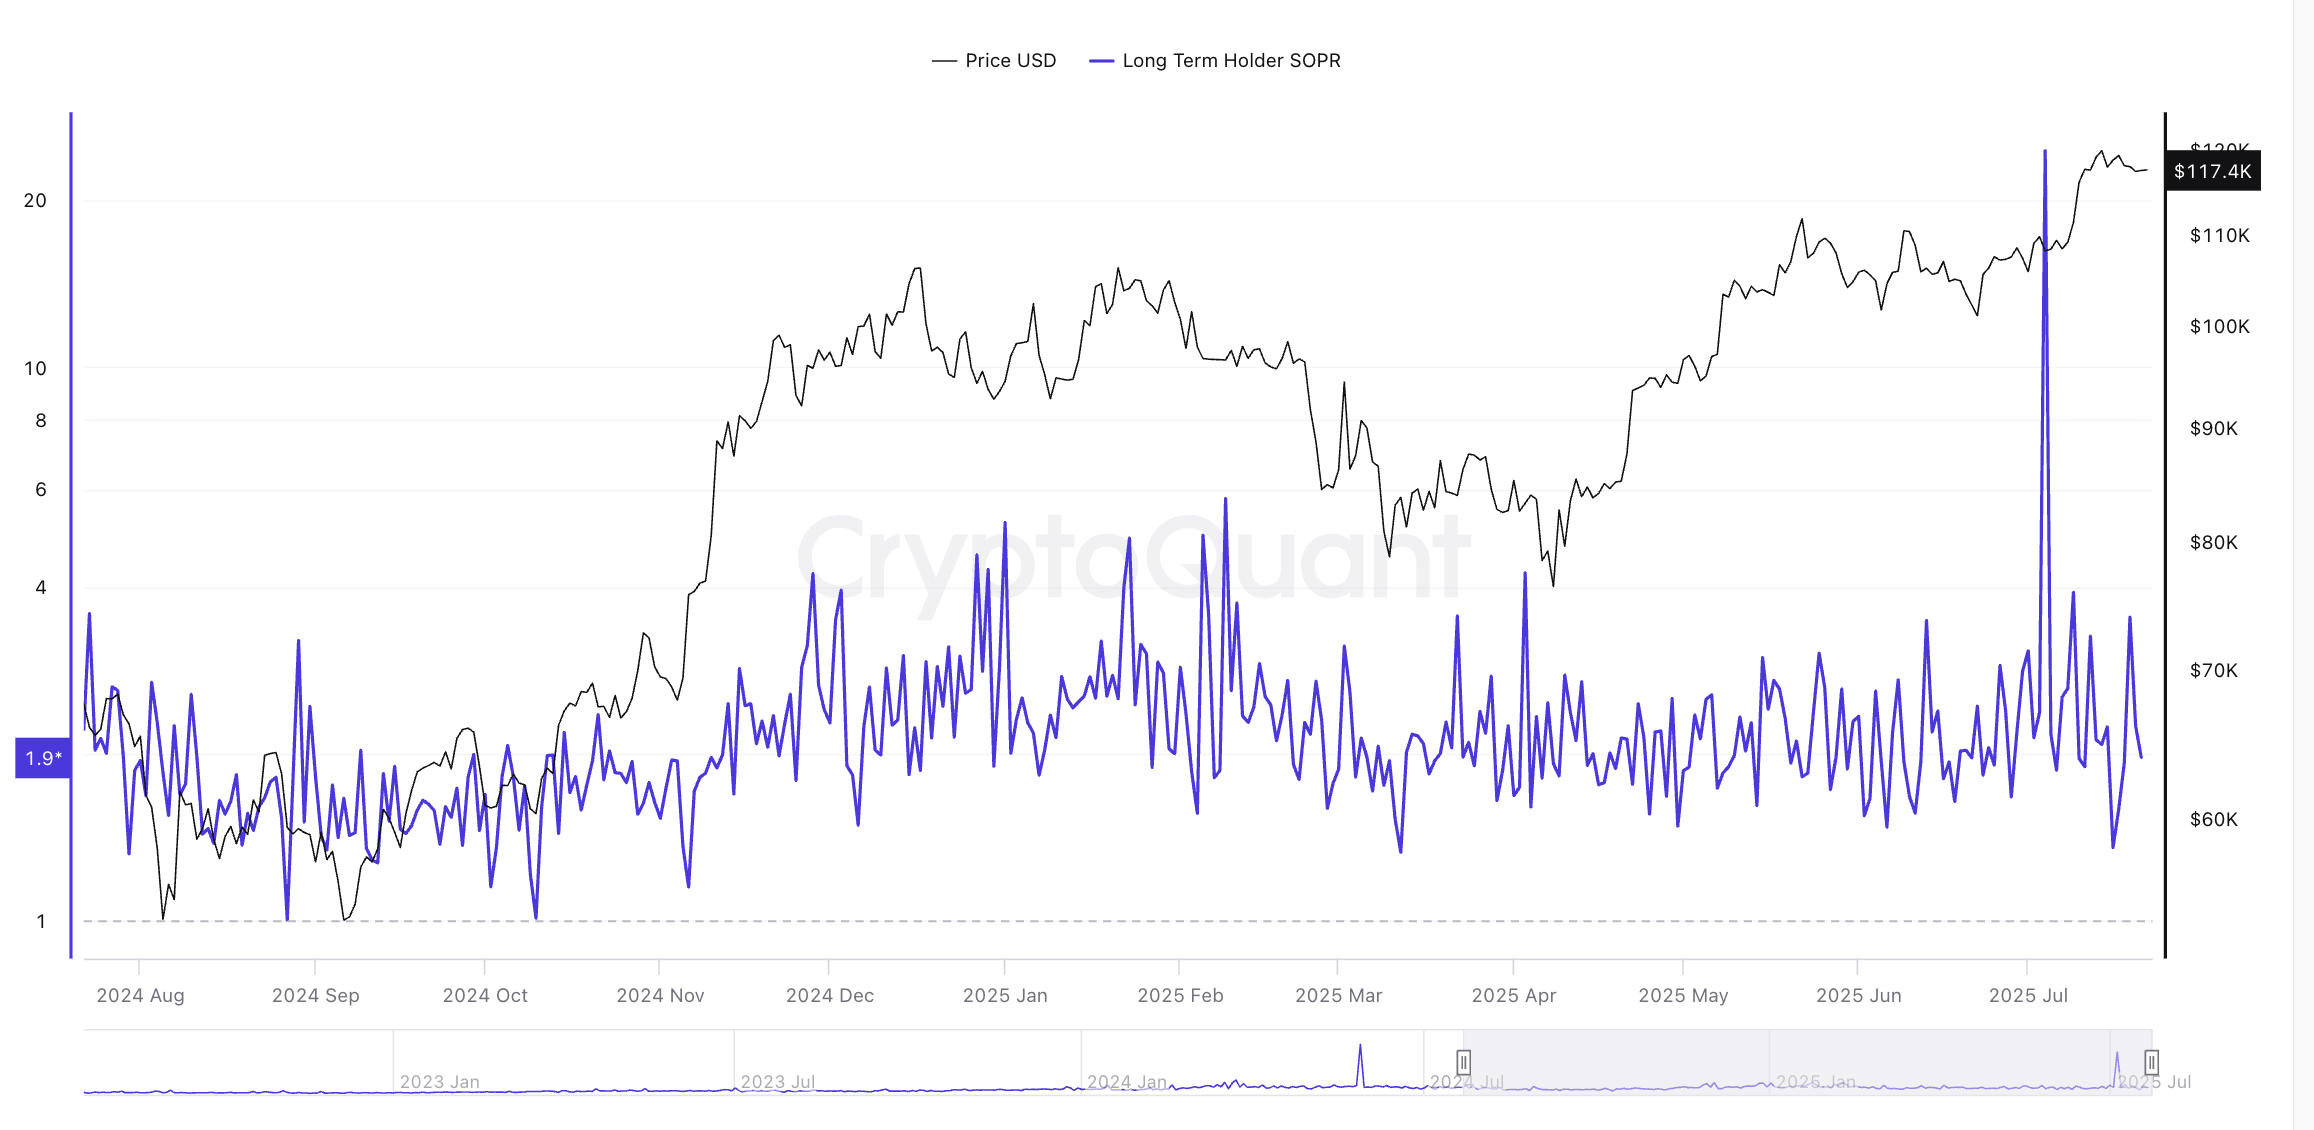
Expanding the one-year chart reveals SOPR spikes historically preceded sharp corrections. Consider:
- February 9: SOPR reached 5.77, BTC dropped from $96,479 to $84,365: 12.55% decline
- June 13: SOPR at 3.47, BTC dropped from $106,108 to $101,003: 4.81% decline
Since July 9, SOPR has shown a series of high peaks:
- 3.90
- 3.25
- 3.50
Note: According to the chart, the largest profit realization was on July 4. The longing SOPR exceeded 24, yet surprisingly, Bitcoin price has not significantly corrected since.
This delayed reaction heightens tension and increases the likelihood of a catch-up correction.
Whale Exchange Ratio Rising Again
Another warning signal comes from the whale-to-exchange ratio. This tracks the amount of BTC whales (large holders) send to exchanges compared to overall market activity.
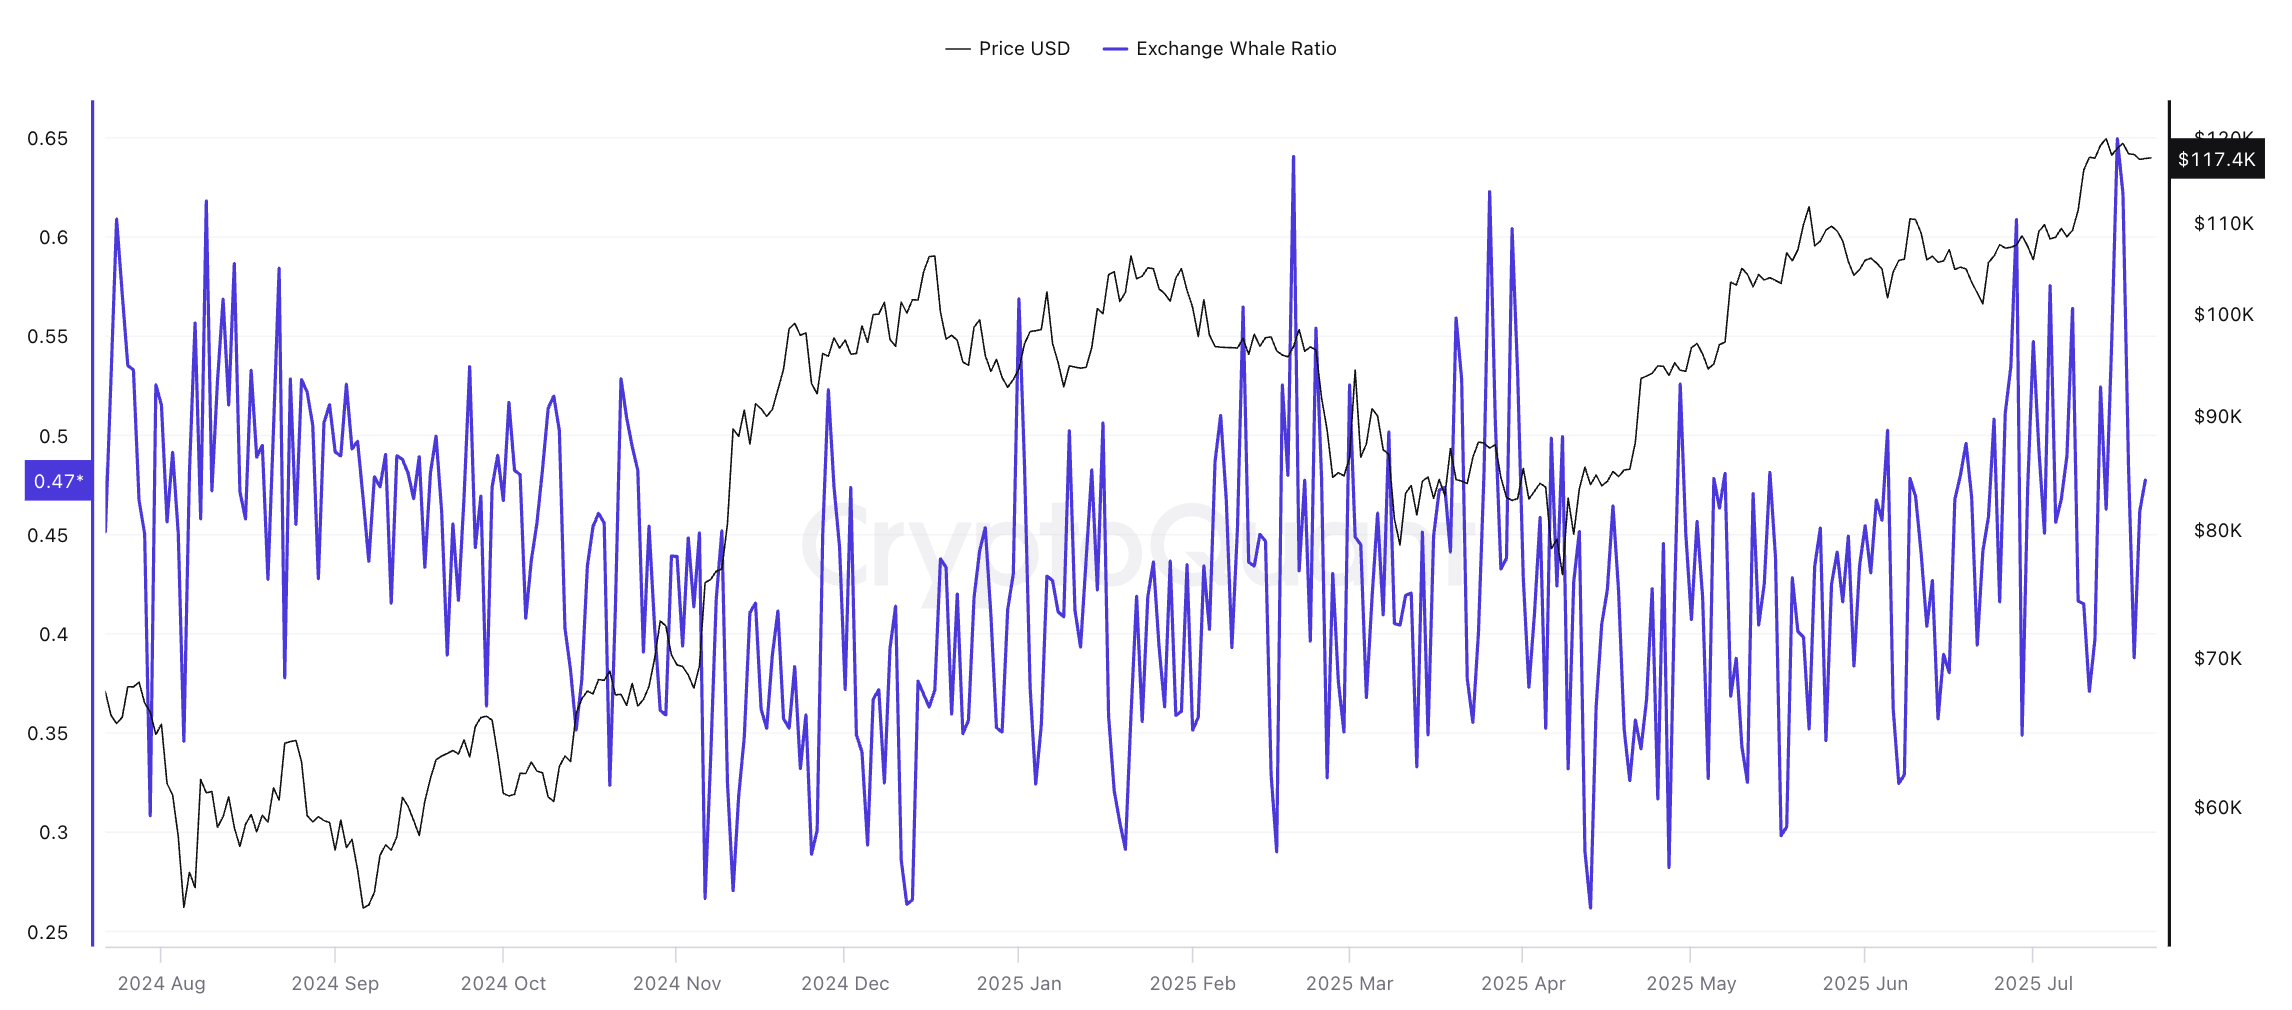
Historically, whenever this ratio touches or exceeds the price trendline, a correction tends to follow. Two recent examples:
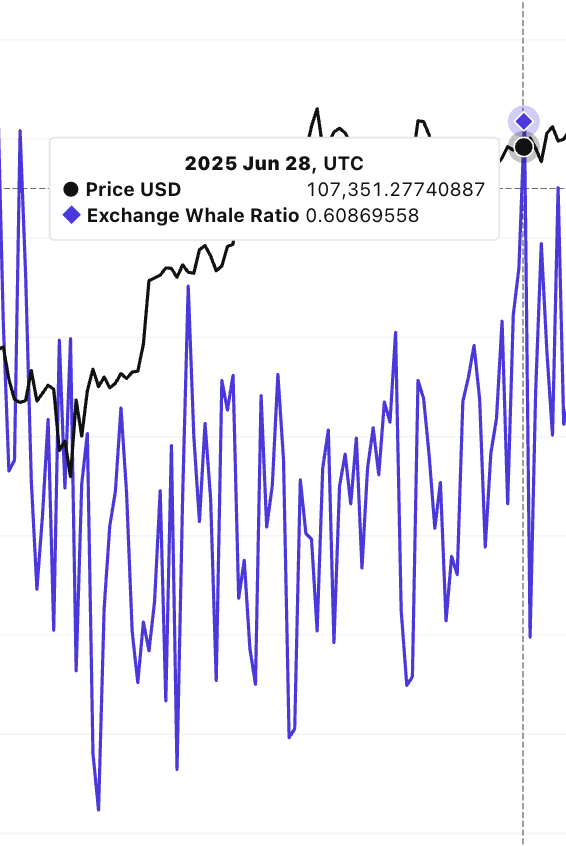
- June 28:
- W2E ratio = 0.608
- BTC = $107,351
- Days later, BTC dropped to $105,727
- July 16:
- W2E ratio = 0.649
- BTC = $118,682
- Price stagnated with signs of weakness
Simply put: When whales move more coins to exchanges, they're usually preparing to sell.
With the W2E ratio again reaching a peak, it suggests distribution pressure is quietly building, even if the spot market appears calm.
Bitcoin Price Structure Depends on Key Support Levels
From a price structure perspective, Bitcoin is currently trading near $117,500, showing signs of uncertainty. Since July 12, the price has repeatedly tested and respected the $116,456 level, which aligns with the 0.236 Fibonacci retracement of the recent impulse move from $98,230 to $122,086.
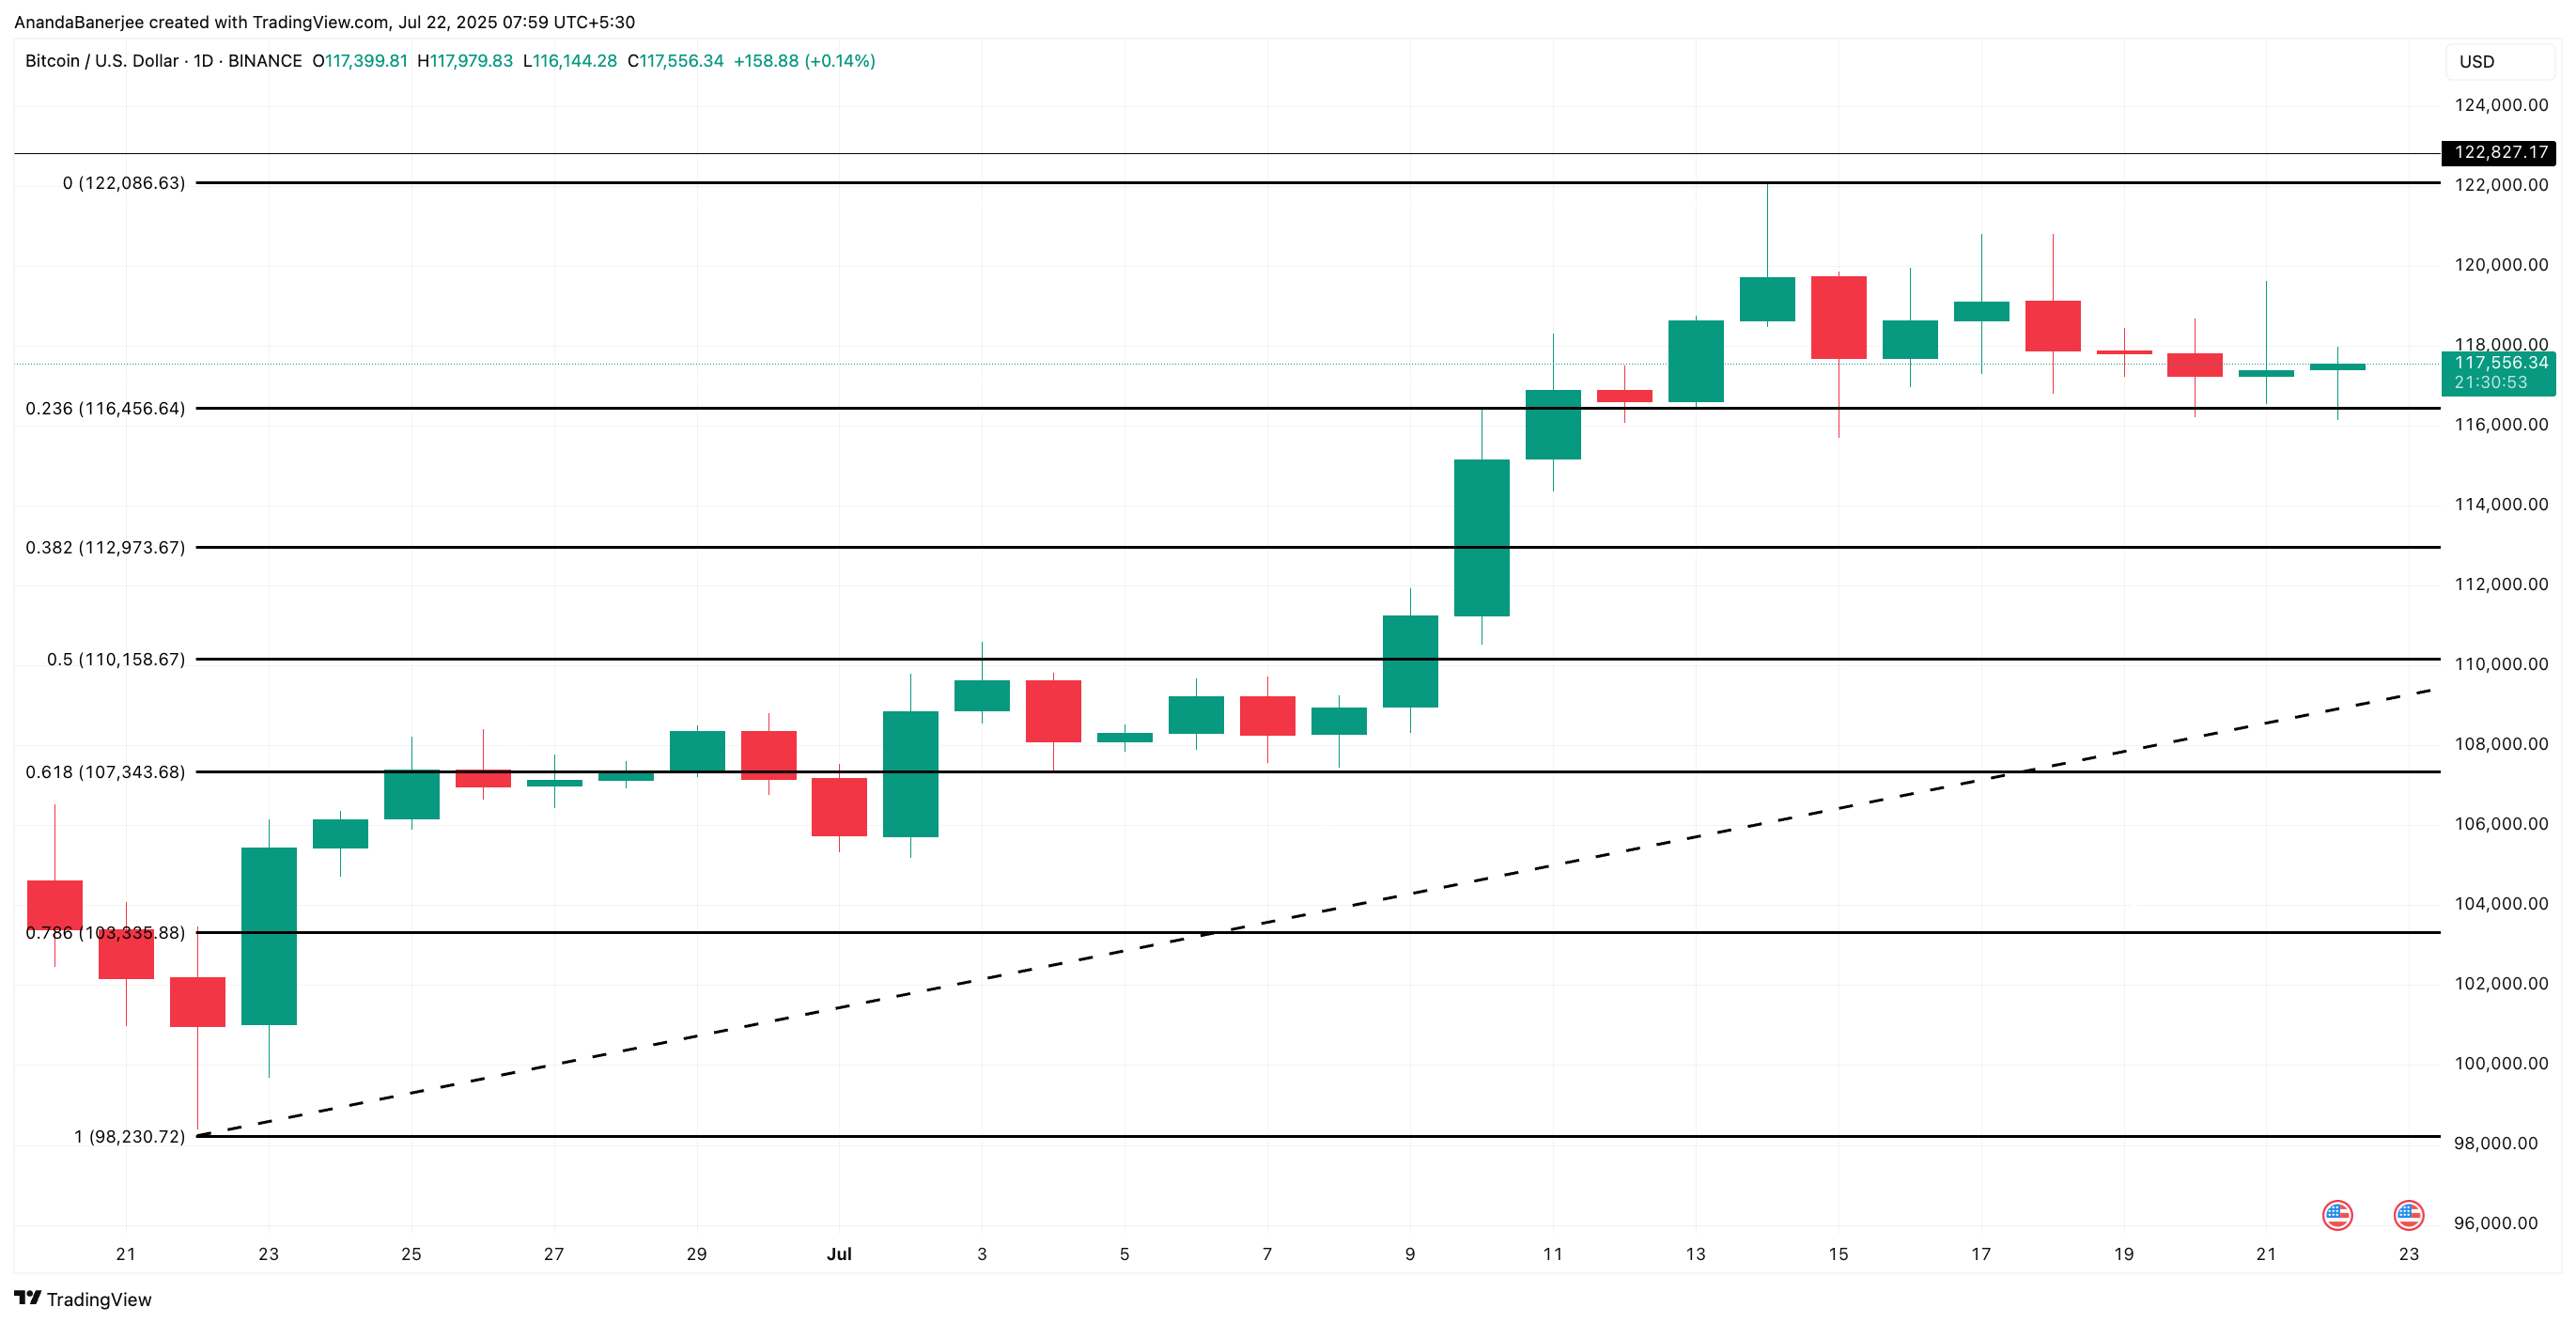
This zone has become a critical battleground. Staying above indicates strength, but a definitive drop below could lead to deeper declines.
The strongest support is at $107,343, representing the 0.618 Fibonacci level. This is considered the golden pocket during corrections. If this level doesn't hold, the market could enter a steeper correction phase. Bitcoin was in a price discovery stage when rising to $122,000, so structural support below this level is limited.
In this case, the next valid support is around $103,355, a 12% correction from the current price. (The February 9 SOPR spike caused a similar correction.)
However, this short-term bearish logic would be invalidated if Bitcoin breaks above $122,086 and recovers the previous high near $122,827. Especially if the SOPR settles and the whale-to-exchange ratio decreases, movement above this zone would indicate new bullish momentum.