Bitcoin (BTC) has continued its upward trend for four consecutive months. However, it closed with a red candle in the first week of July.
Many analysts believe that the bull market has not yet ended. However, concerning signals have begun to emerge, suggesting the possibility of a price correction or consolidation.
Bitcoin Correction After 4 Months of Increase?
These warning signs do not necessarily mean that Bitcoin will reverse. However, they serve as early indicators that require attention before any strong movement or high volatility occurs.
1. Significant Increase in Whale Inflows to Exchanges
First, Bitcoin whale-exchange inflow data increased significantly in July. This indicator reflects the amount of BTC sent to exchanges by large holders (whales), typically indicating selling intentions.
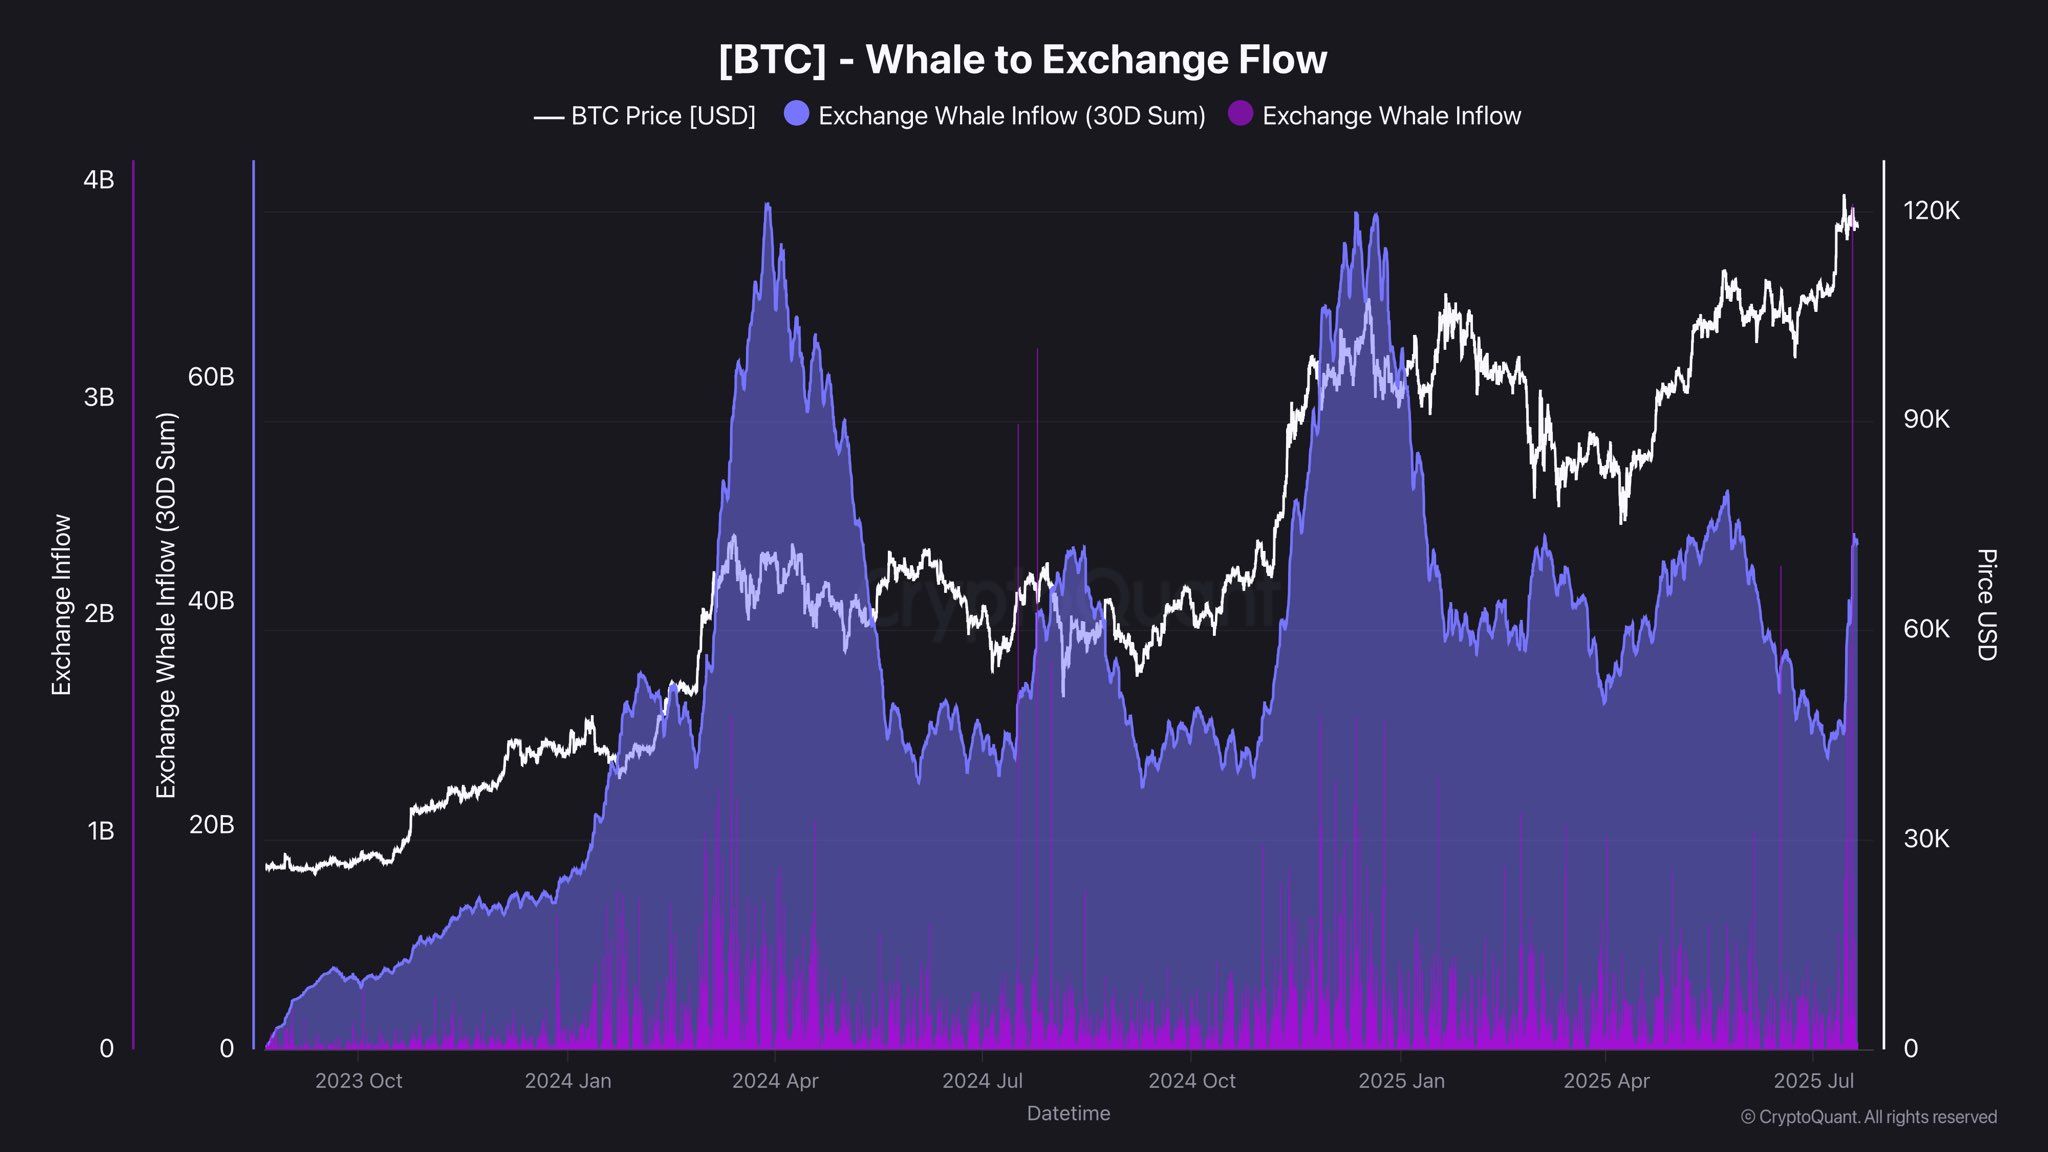
According to analyst Darkpost, whale capital inflows exceeded $75 billion at the last two market peaks. This indicates the beginning of a correction or consolidation phase. From July 14 to July 18, 2025, this figure already reached $45 billion. This sharp increase indicates increased activity among large investors.
"[This whale activity] must be carefully monitored. Whales can exert significant selling pressure, as they did at the last two peaks." Darkpost said.
Darkpost's view aligns with LookOnChain's recent on-chain observation. Today, LookOnChain reported that a Bitcoin whale sent 400 BTC (worth $47.1 million) to Binance to realize profits, with total realized profits reaching $91.5 million.
2. Bitcoin CDD at Annual High
In addition to whale inflows, on-chain data shows another signal. Bitcoin's Coin Days Destroyed (CDD) reached a one-year high in July.
CDD measures the period coins are held before being moved. It reflects the psychology and behavior of long-term holders. A high CDD value suggests that long-term holders are likely to move and sell coins.
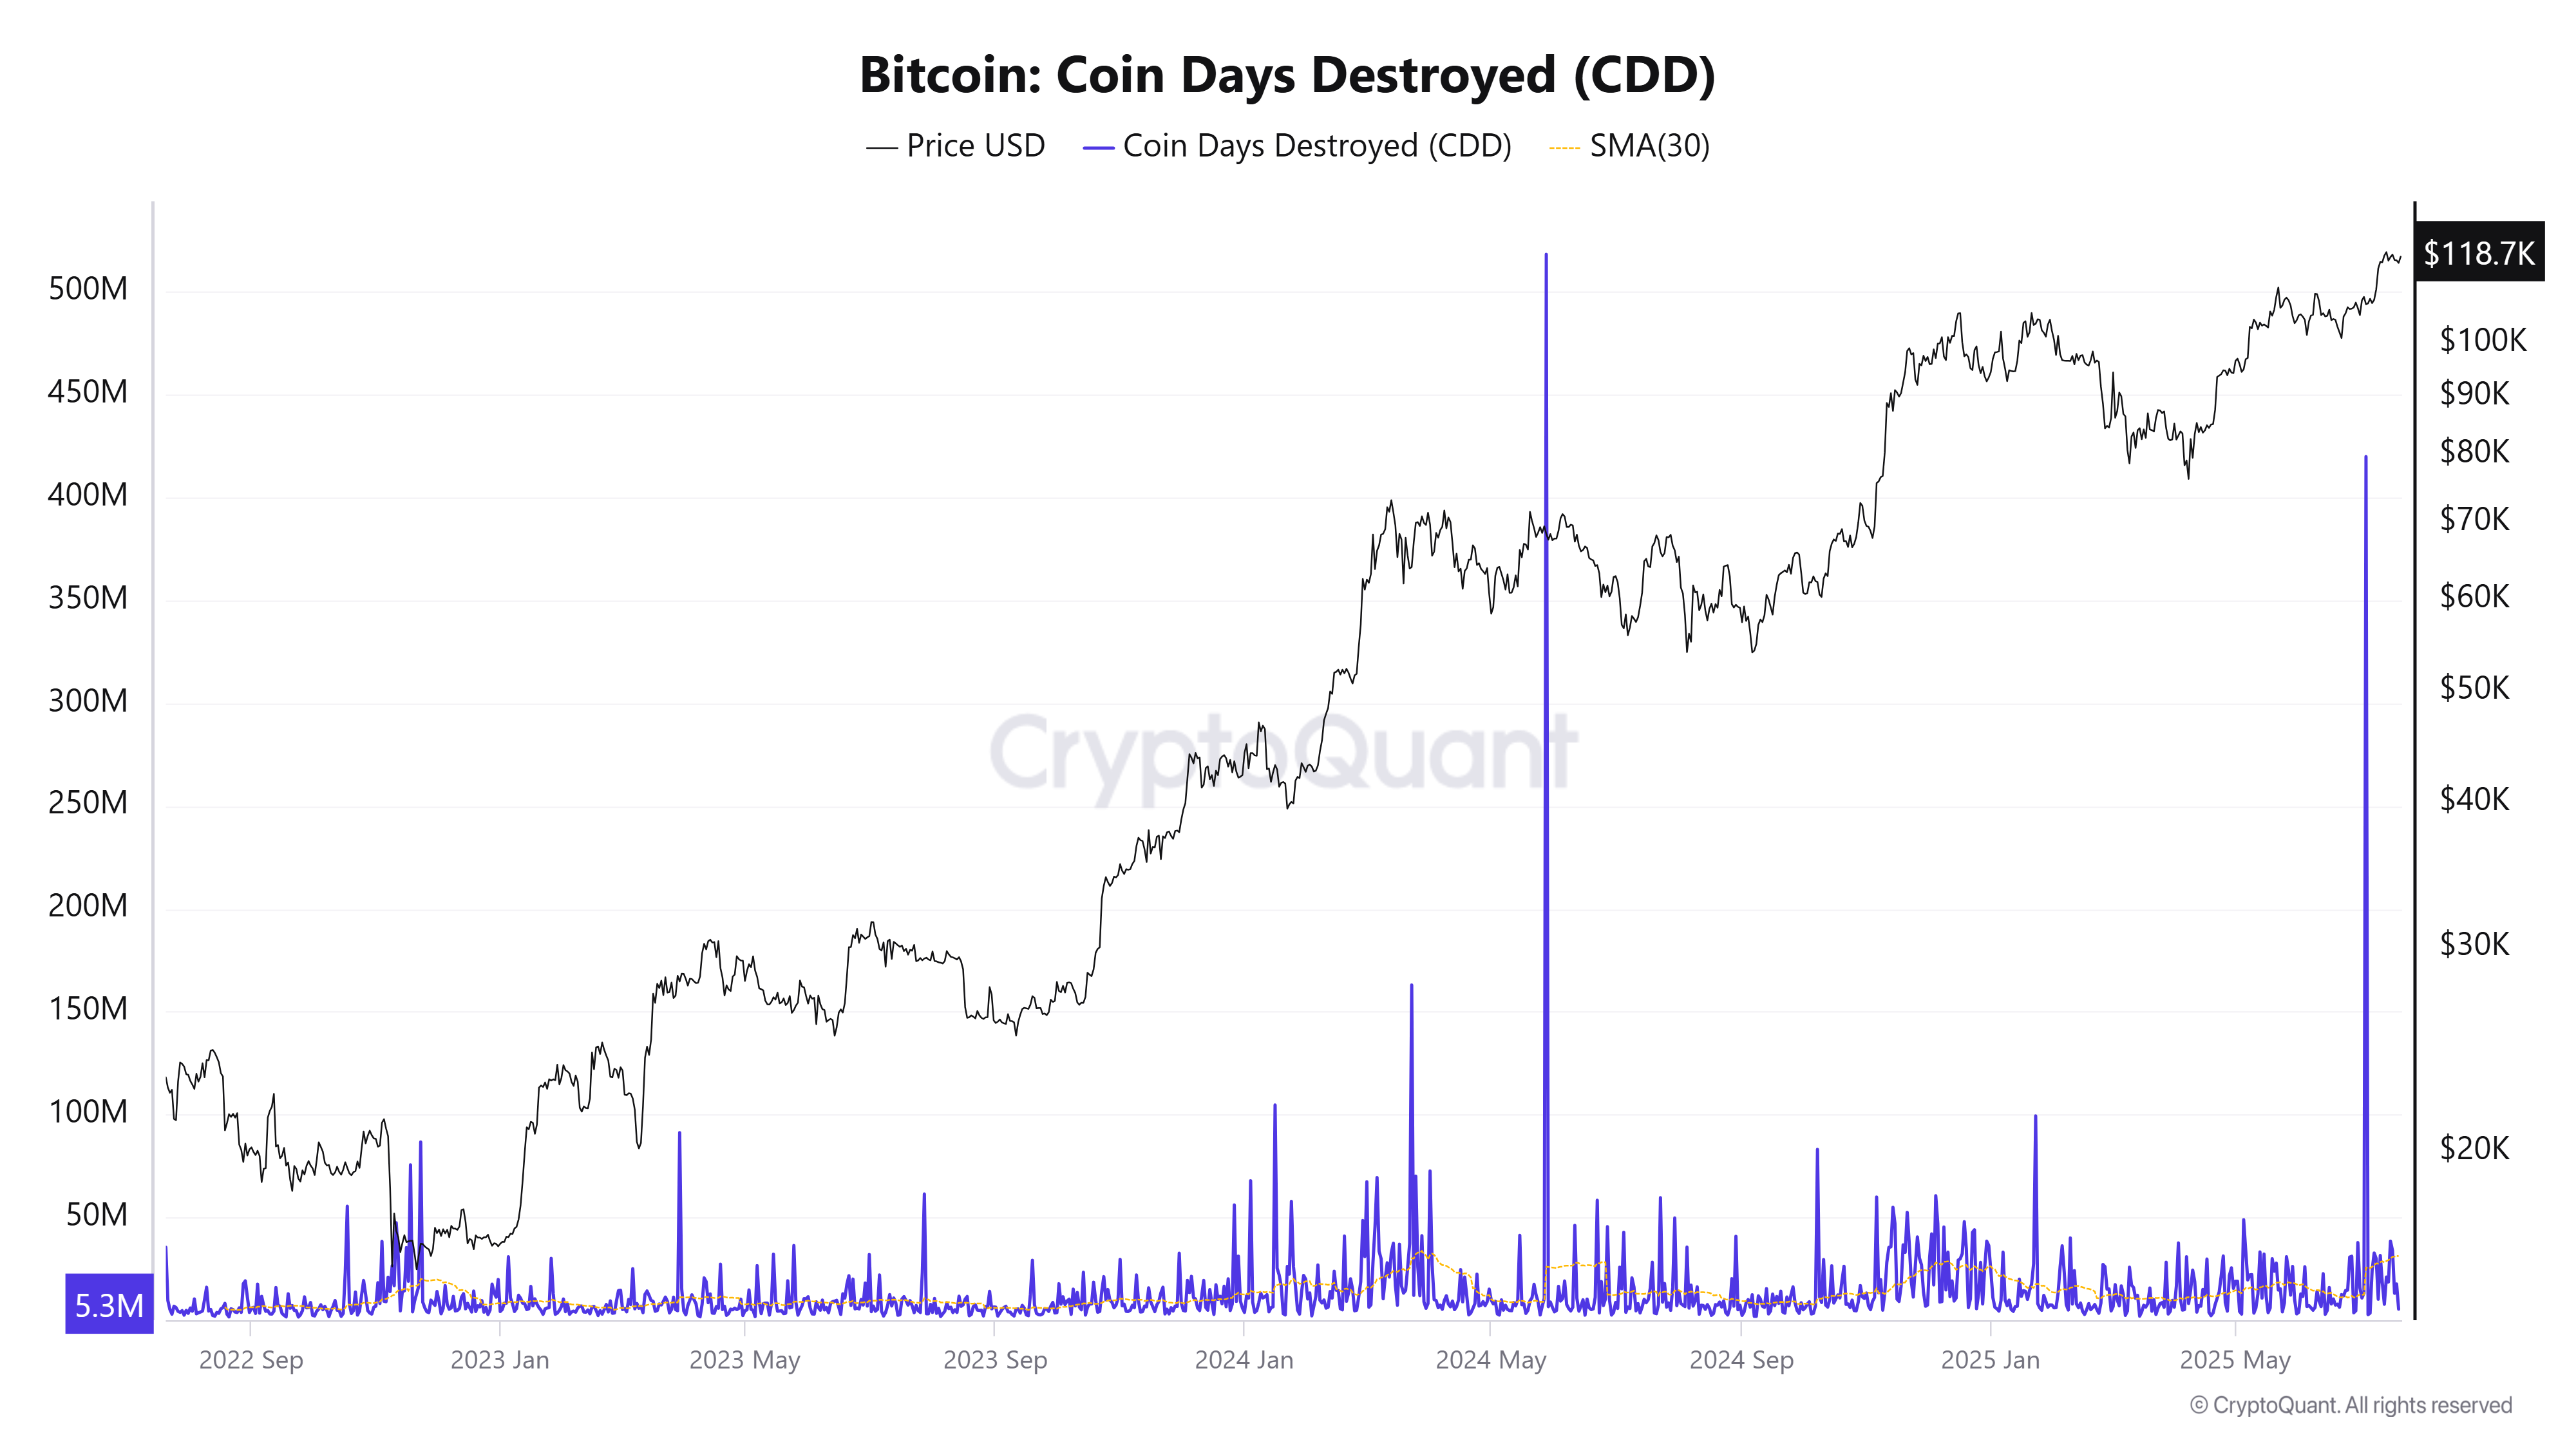
According to Cryptoquant, the average CDD on July 30 exceeded 31 million, the highest since April 2024. Previous BeInCrypto reports mentioned that a spike in this indicator often occurs before major market corrections. However, from a positive perspective, it could also be seen as redistribution to new investors.
3. Altcoin-Bitcoin Correlation Turns Negative
Lastly, changes in the correlation between altcoins and Bitcoin have raised additional concerns.
According to Alphractal, the altcoin-Bitcoin correlation heatmap recently dropped below 0. This change means that altcoins have outperformed Bitcoin in recent days.
However, historical data shows that a low correlation between Bitcoin and altcoins is often a warning sign.
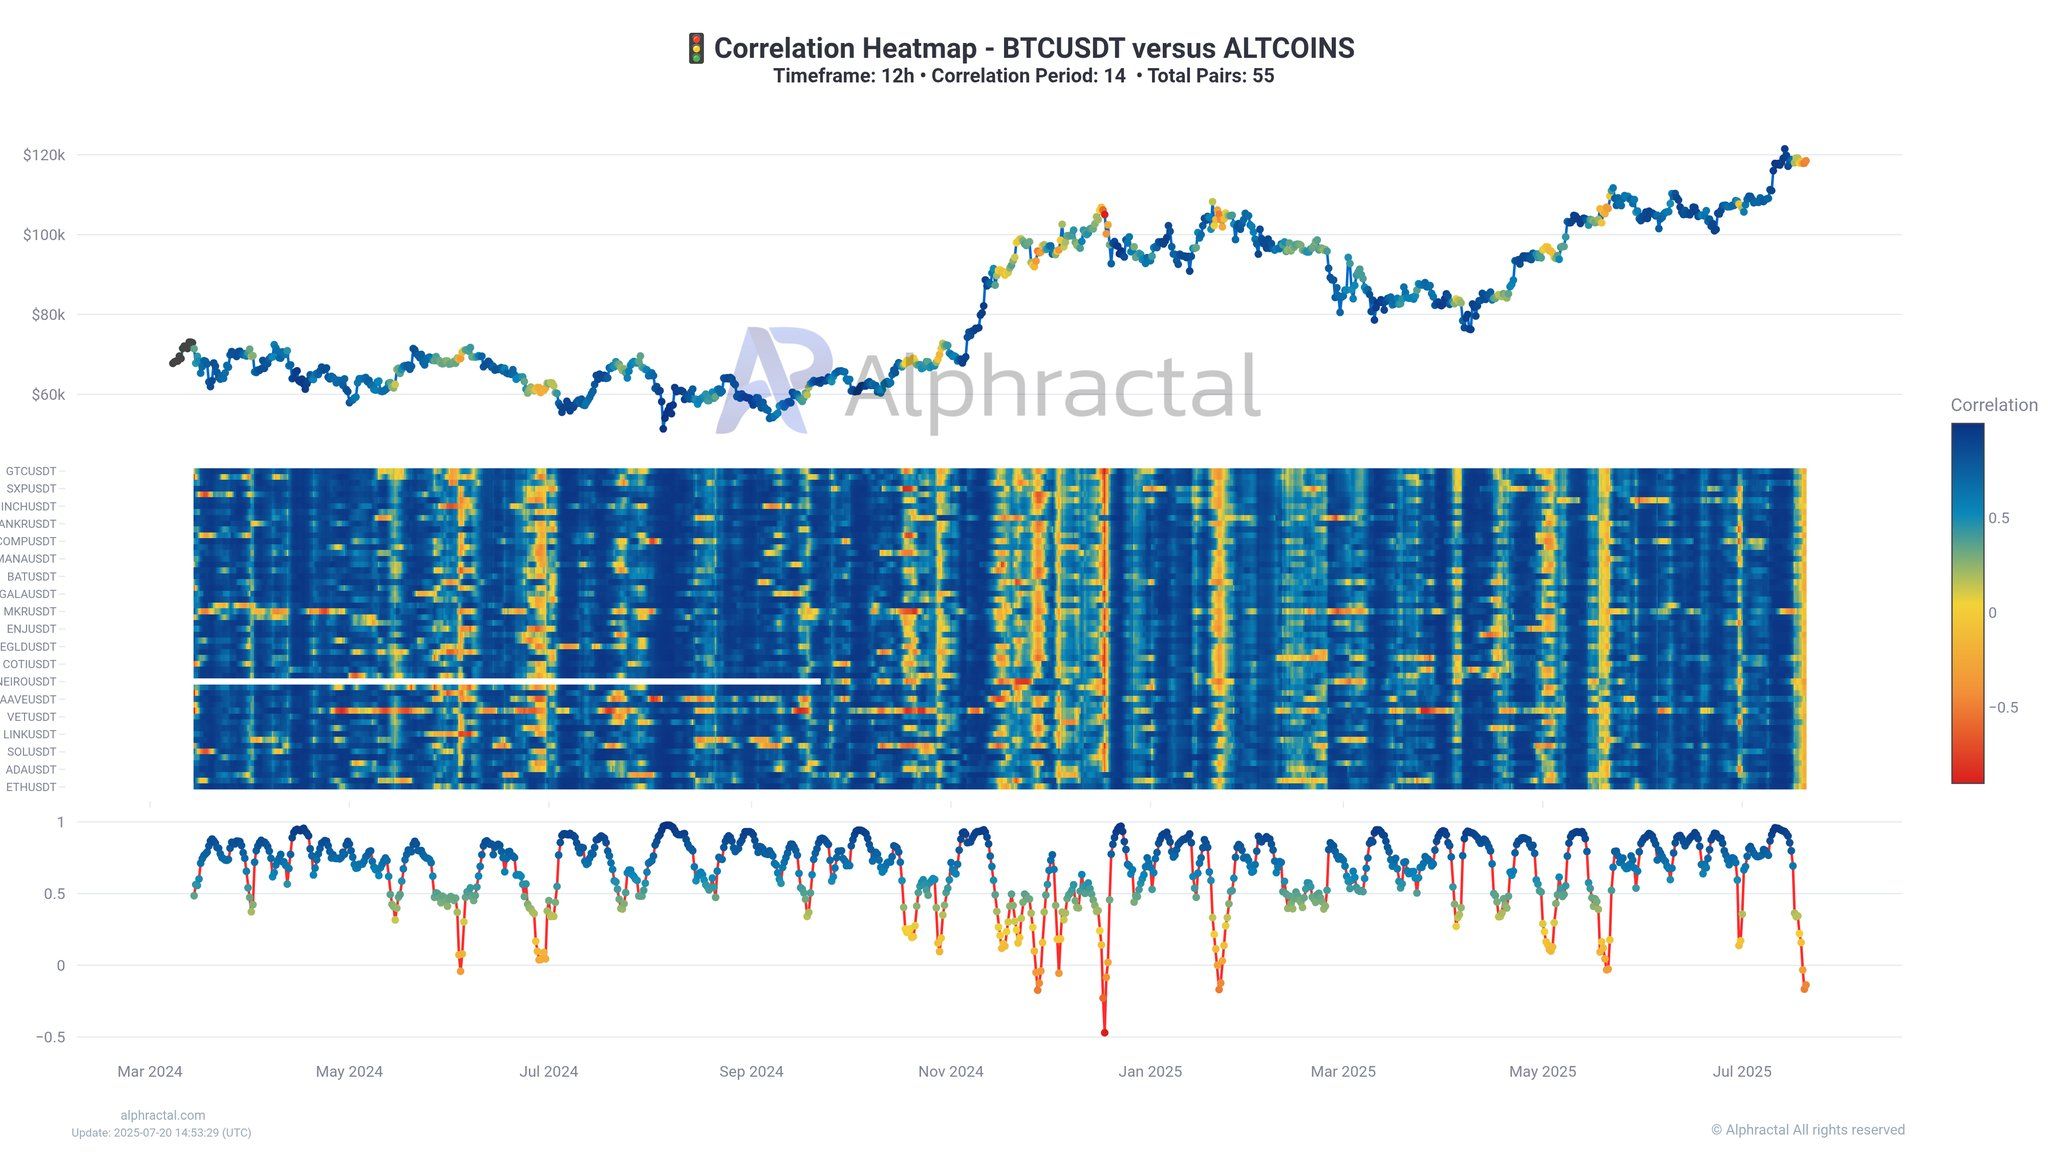
From early 2025, this indicator has turned negative three times. The first occurred in January, with Bitcoin's price dropping from $110,000 to $74,900. The second was in May, with BTC falling from $112,000 to $98,500. Now we are seeing the third occurrence.
"Historically, low correlation is a warning sign. It often occurs before periods of high volatility and large liquidations — in both short and long positions." Alphractal warned.
A recent BeInCrypto report also highlighted another concerning signal. The Coinbase premium has separated from the Kimchi premium. This separation primarily suggests a regionally unbalanced bull market driven by strong institutional demand in the US.