Author: Basit
Compiled by Luffy, Foresight News
TL;DR
- On Hyperliquid alone, traders pay millions of dollars in funding fees (annually);
- The funding rate on Binance is as high as hundreds of millions of dollars. As for other platforms? I can’t count them at the moment.
- The article contains a lot of basic calculations, so if you don’t have patience, you can skip it.
The funding rate was originally designed to encourage fair market transactions, but now it has become a harvesting ground for arbitrageurs.
What is the funding rate?
Funding rate is a fee paid regularly between traders (long and short) to balance the spread between perpetual contract price and spot price.
For smart players, this seemingly insignificant "change" can eventually accumulate into millions of dollars in profits.
The core question I asked in this research was, “How much money do people actually make by arbitrage funding rates?” In other words, “How much funding rates are traders paying to each other?”
But to clarify this issue, we must first clarify:
- The total cumulative funding paid across all cryptocurrency perpetual contract markets is a staggering figure, potentially reaching hundreds of millions of dollars.
- The total funding rate for a specific exchange (e.g., Binance, Bybit, Hyperliquid, dYdX, etc.);
- The total funding rate for a single asset (e.g., Ethereum perpetual swaps since launch or in a single year).
In short: there is currently no publicly available statistics on the total cumulative funding rates for all cryptocurrency perpetual contracts.
Most exchanges and data providers publish funding rates, open interest (OI), and historical data, but no one aggregates every funding rate payment across all platforms into a single official number.
However, I will:
- Explain why there is no accurate data on “total global funding rates”;
- Share the "simple and correct method" for calculating the total funding rate;
- Provides "rough but transparent estimated ranges", including: global annual funding rate scale, Binance's reasonable estimated scale, and Hyperliquid's reasonable estimated scale.
Why is there no "Cumulative Funding Rate Total"?
Funding rates are peer-to-peer transfers between long and short traders, and are recorded differently across centralized exchanges (CEXs), decentralized exchanges (DEXs), and on-chain systems.
Data providers like Coinglass provide funding rates, open interest, and historical charts, but they don’t publish the cumulative total funding rates across all platforms and markets. This is because funding rates are generated between traders, not collected by the platforms.
To calculate this total, we need to obtain time series data of "funding rate × open interest" from all relevant platforms and then make a reasonable estimate.
This study uses Ethereum (ETH) perpetual contracts as an example for analysis.
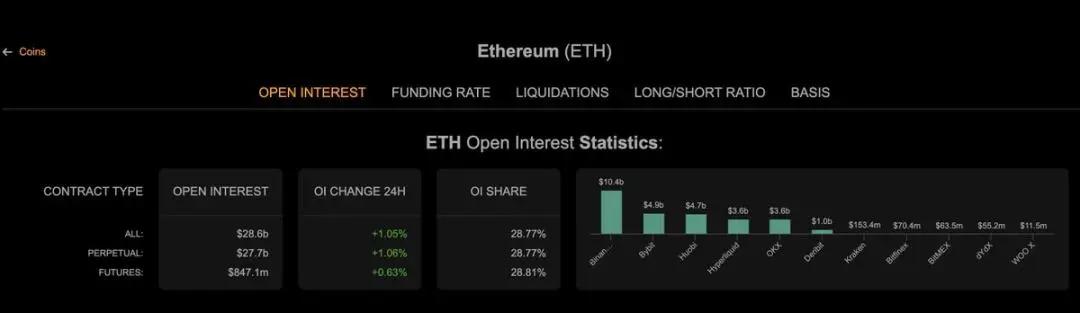
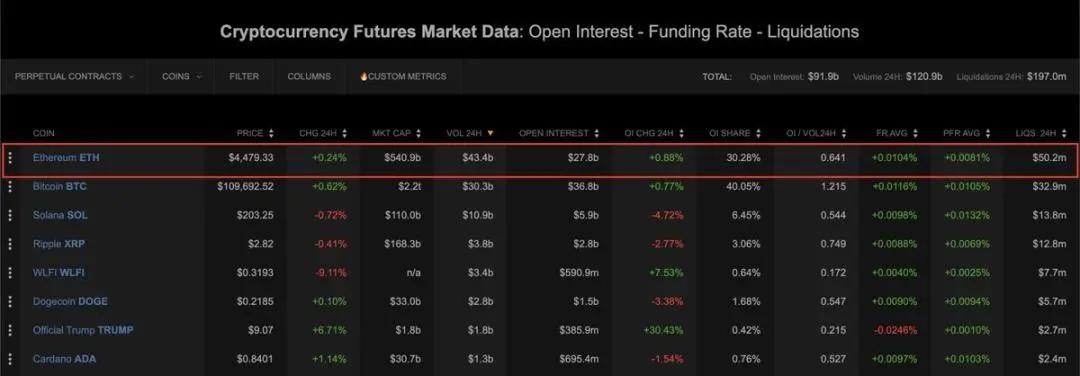
Ethereum open interest data across different platforms
Correct calculation method
For any perpetual contract market and any time window, the total funding rate can be calculated using the following formula:
The total funding rate for a certain period of time ≈ Σₜ [funding rate at a certain time (t) × open interest at a certain time (t) × time interval (Δt)]
in:
- Funding Rate (t): the actual funding rate at a timestamp (t);
- Open interest (t): Notional open interest in USD.
- Time interval (Δt): Funding rate settlement cycle (most centralized exchanges are 8 hours/time, or 3 times a day).
Therefore, we can calculate the exact total funding rate by integrating historical data series from platforms such as CoinGlass.
My estimate
To arrive at a “range of estimates” rather than a “single, illusive number,” I used a variety of assumptions, ranging from conservative to aggressive:
Common choices:
- Statistical time range: January 1, 2025 to August 27, 2025, a total of 239 days (calculated based on three settlements per day, a total of 717 settlement cycles);
- Funding rate settlement cycle: 8 hours/time (3 times per day, applicable to Binance and most perpetual contract platforms);
- Ethereum perpetual swaps "total market notional open interest": divided into three scenarios - $20 billion (low), $27.6 billion (medium, current actual data), $30 billion (high);
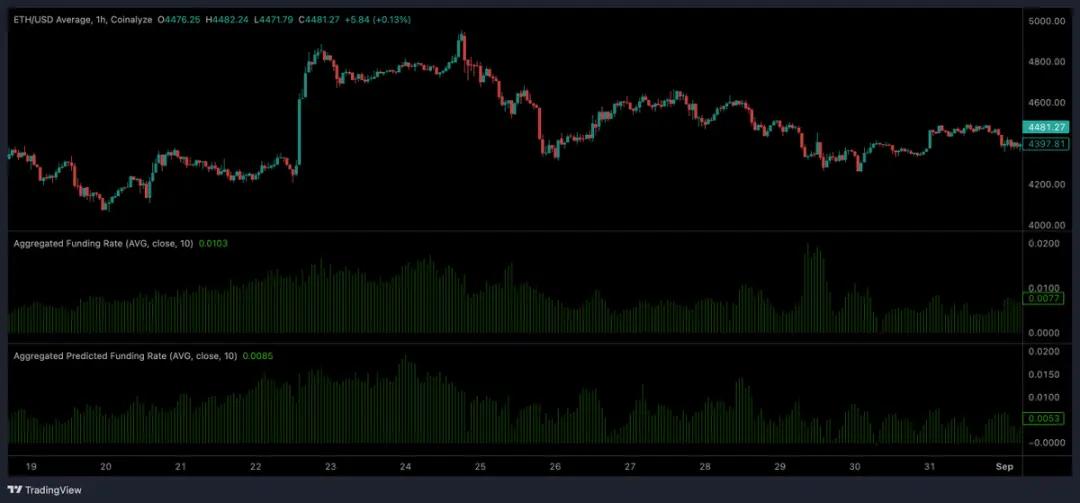
- Ethereum’s “Average Funding Rate Weighted by Open Interest (Every 8 Hours)”: Using aggregated data, 0.000103 (i.e. 0.0103%).
As you can see, the open interest for all Ethereum perpetual contracts is actually $27.7 billion.
When the funding rate is positive, longs pay shorts; when it is negative, shorts pay longs. Different assumptions will lead to different results on the "conservative vs. aggressive" scale.
Annual estimation formula (based on the above time window)
Total annual funding rate ≈ Average open interest × Average funding rate per cycle × (239 days × 3 times/day)
Estimated results: Global annual funding rate scale (rough range)
Calculated based on 239 days of data and the above formula
- Conservative scenario (open interest of $20 billion, average fee rate of 0.000103) → approximately $1.48 billion;
- Medium scenario (open interest of $27.6 billion, current real data, average fee rate of 0.000103) → approximately $2.04 billion;
- Aggressive scenario ($30 billion open interest, average fee rate 0.000103) → ~$2.2 billion.
Interpretation: Based on a medium scenario (current Ethereum open interest), the total annual funding rate for global cryptocurrency perpetual contracts is estimated to be around the lower end of the billion-dollar range. In extreme periods of high leverage (soaring funding rates + high open interest), the annual total could reach billions of dollars.
Note: This is an aggregate estimate rather than a precise measurement, as we use the Ethereum market average assumption. (The above method and examples can also be applied to other assets, such as Bitcoin.)
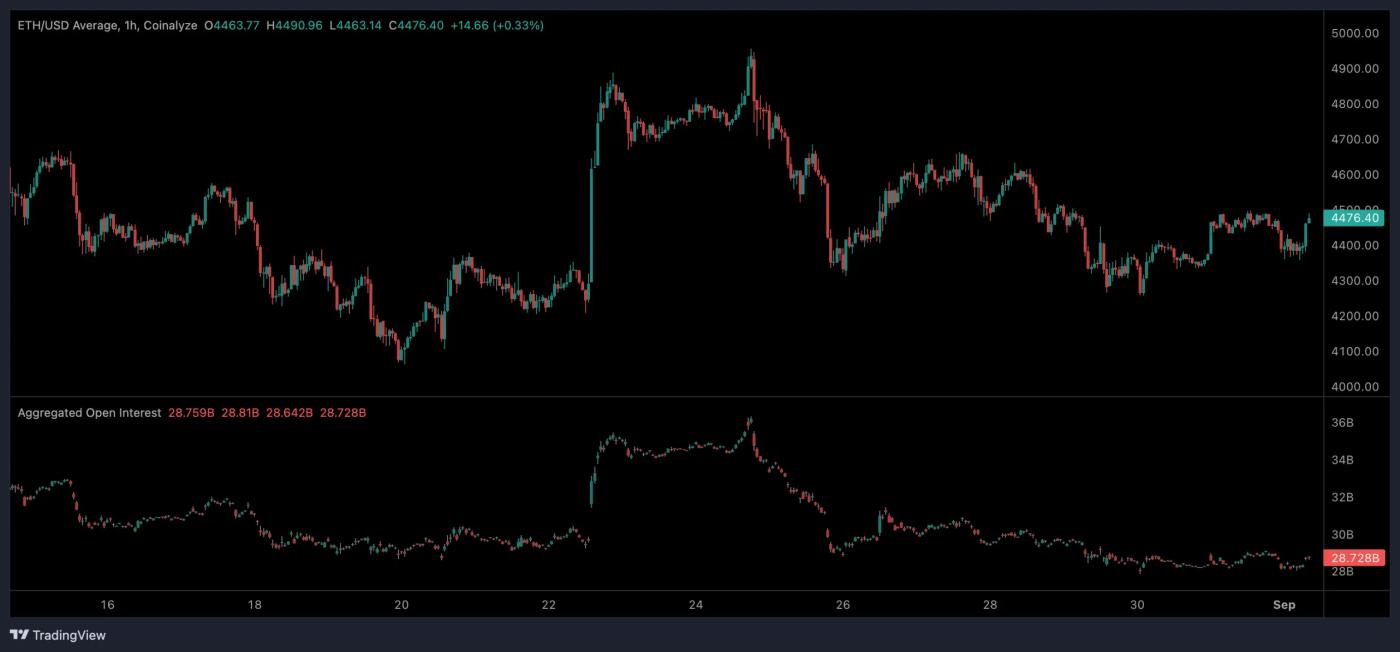
Ethereum average funding rate chart
Estimated Results: Binance’s Reasonable Size by Market Share
Binance holds a significant market share in perpetual contract trading (this study uses a tentative estimate of 17%, though you can adjust this percentage based on your preference).
Substituting a 17% market share into the global scale scenario above:
- Conservative scenario → approximately $251 million in 239 days;
- Medium scenario → approximately $347 million over 239 days;
- Aggressive scenario → approximately $377 million in 239 days.
This number may seem shocking, but it does make sense.
Estimation: Hyperliquid's scale
Hyperliquid is much smaller than Binance (although I think this may change soon).
Assuming that Hyperliquid Ethereum perpetual contract open interest accounts for about 5.3% of the global market (a very rough estimate), substituting it into a global scale scenario:
- Conservative scenario ($1.48 billion globally) → approximately $78.3 million in 239 days;
- Medium scenario ($2.04 billion globally) → approximately $108 million over 239 days;
- Aggressive scenario ($2.22 billion globally) → approximately $117.4 million in 239 days.
Core summary: What’s in it for you?
- Currently, there is no publicly available accurate data on the total global cumulative funding rate. Claims that the total cumulative funding rate = $X are based on data from multiple sources (and assumptions similar to those in this article).
- The actual size of the global annual funding rate is likely to be in the “lower billions of dollars” to “higher billions of dollars” range, depending on market conditions (estimated at around $2-5 billion/year based on a reasonable mid-case scenario);
- Binance’s annual funding rate could reach “hundreds of millions of dollars” (depending on market share and funding rate fluctuations);
- Hyperliquid is relatively small, with annual funding rates in the "millions to hundreds of millions of dollars" range, depending on its average open interest.