The native coin M of MemeCore, the first layer-1 (L1) blockchain built for memes, recorded the largest increase in the cryptocurrency market today. The price of this coin surged by more than 20% in the past 24 hours.
With the formation of an upward momentum, M may be preparing for further short-term gains.
M Surges by Double Digits... Led by Bull Market
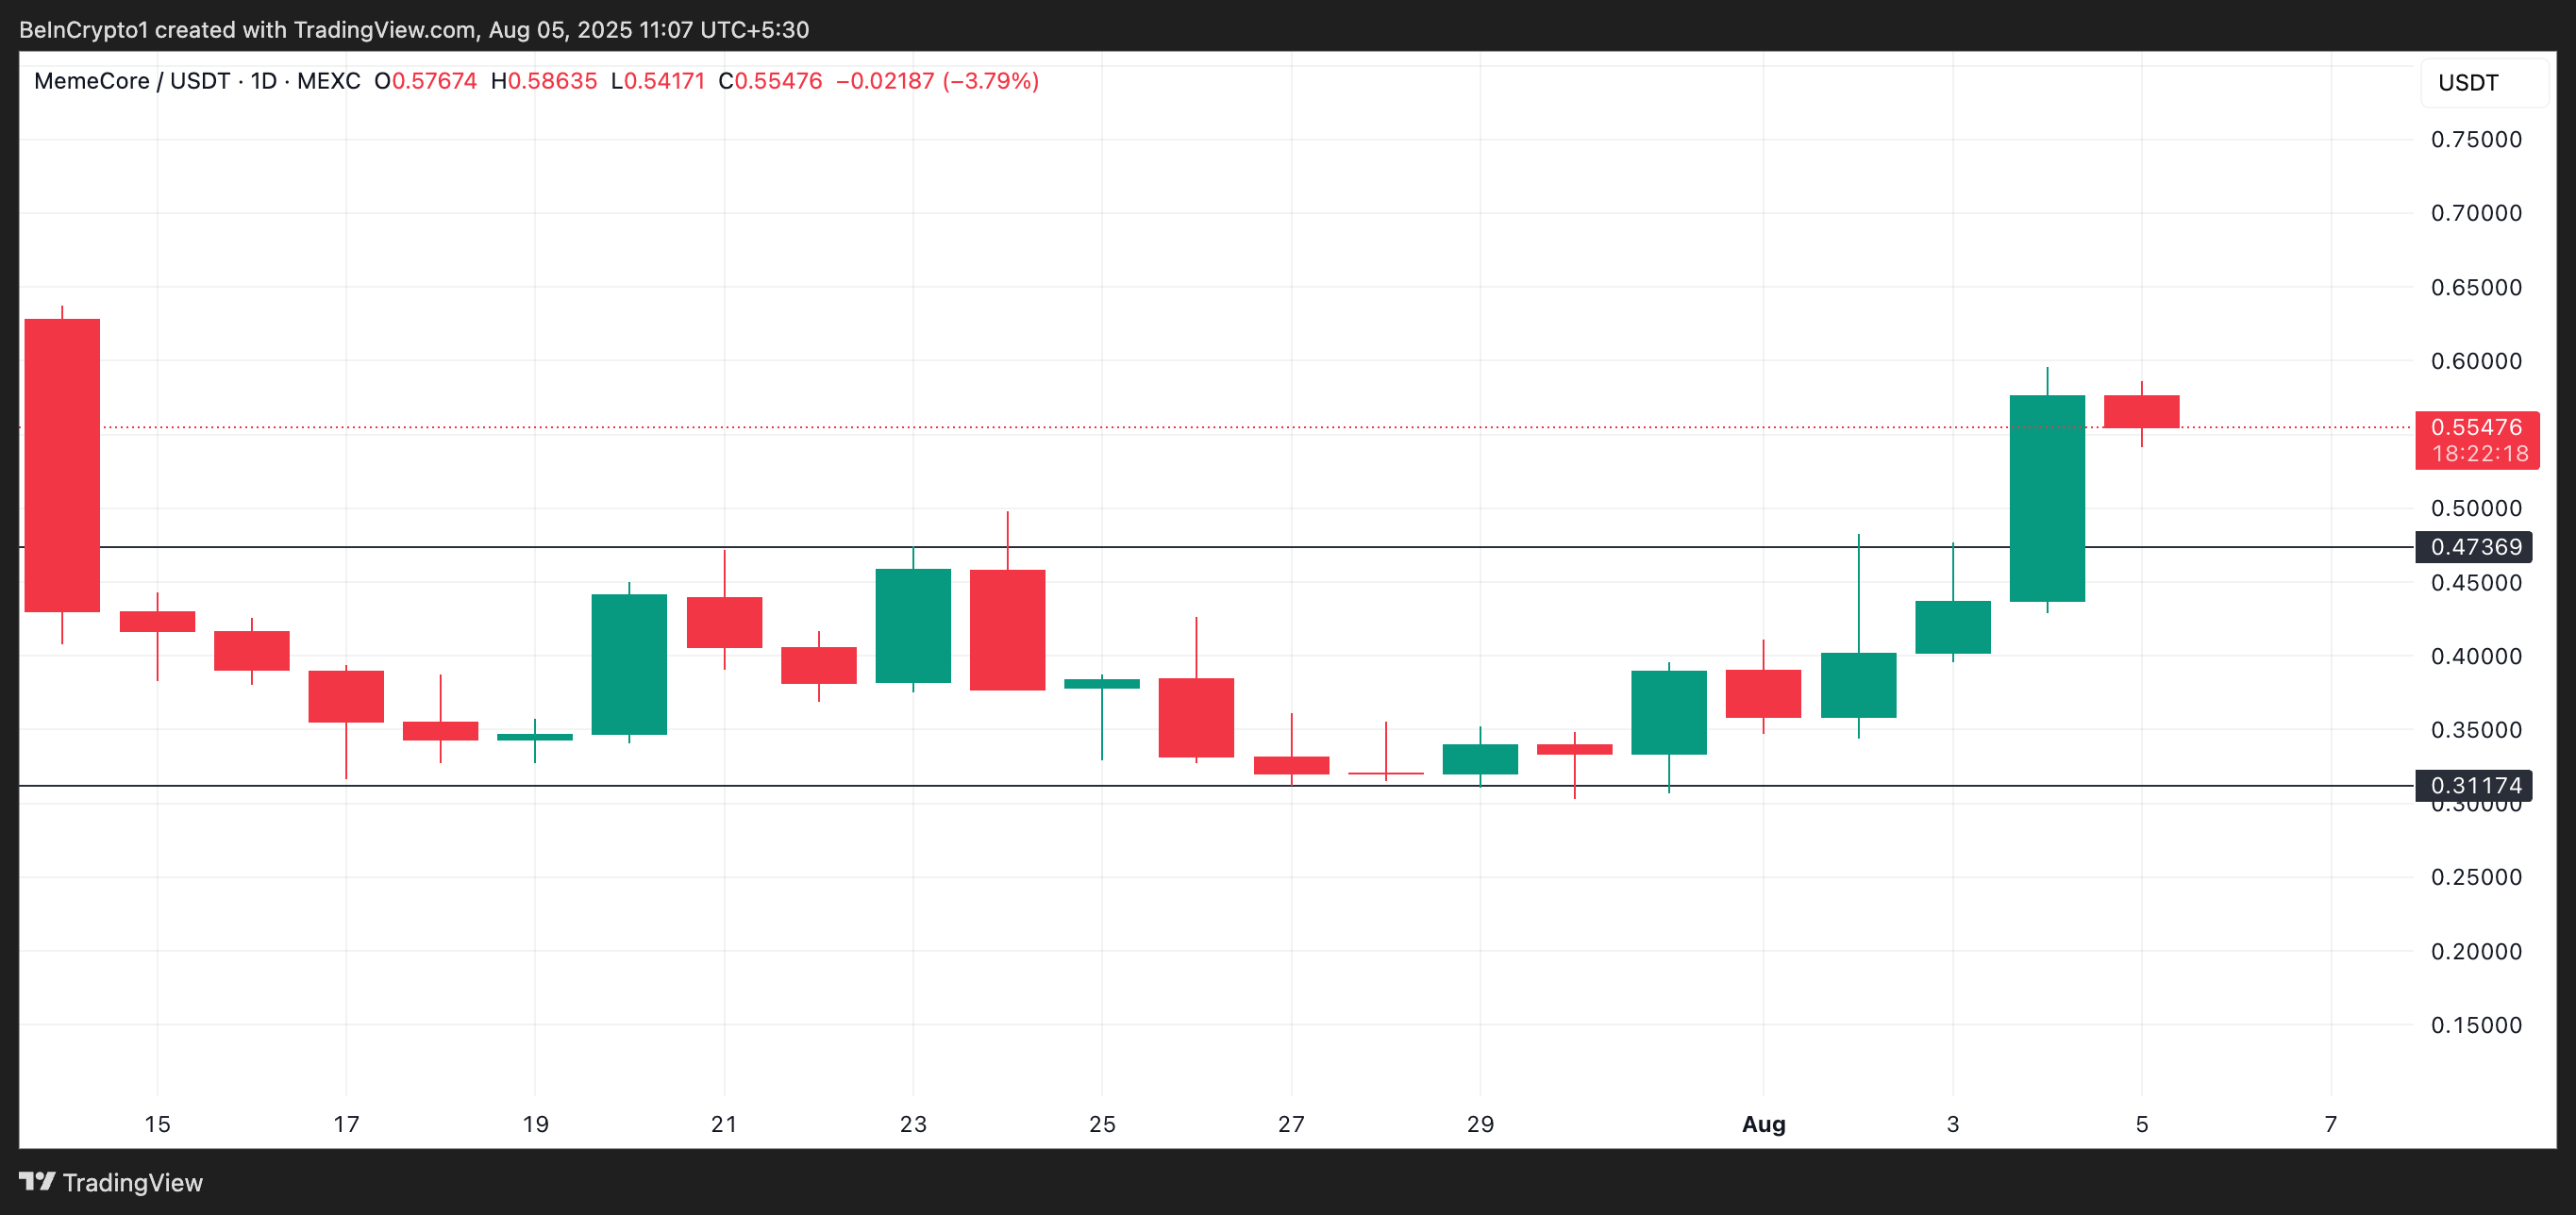
The double-digit rally of M occurred after breaking out of a narrow trading range from July 15 to August 4. During this period, the altcoin faced resistance at $0.47 and found solid support at $0.31, forming an uncertain channel in the market.
However, with the revival of new demand, M has now broken through the $0.47 price barrier, signaling a potential shift in sentiment.
Token TA and Market Update: Want more such token insights? Subscribe to the daily crypto newsletter by editor Harshi Notariya here.
Technical indicators like M's Chaikin Money Flow (CMF) tracking capital flow on the daily chart confirm that a positive bias is being strengthened, supporting the possibility of further increases.
At the time of writing, the momentum indicator is at 0.01, having just crossed the zero line. This change indicates that buying pressure has begun to exceed selling activity, which is an initial confirmation of upward momentum.
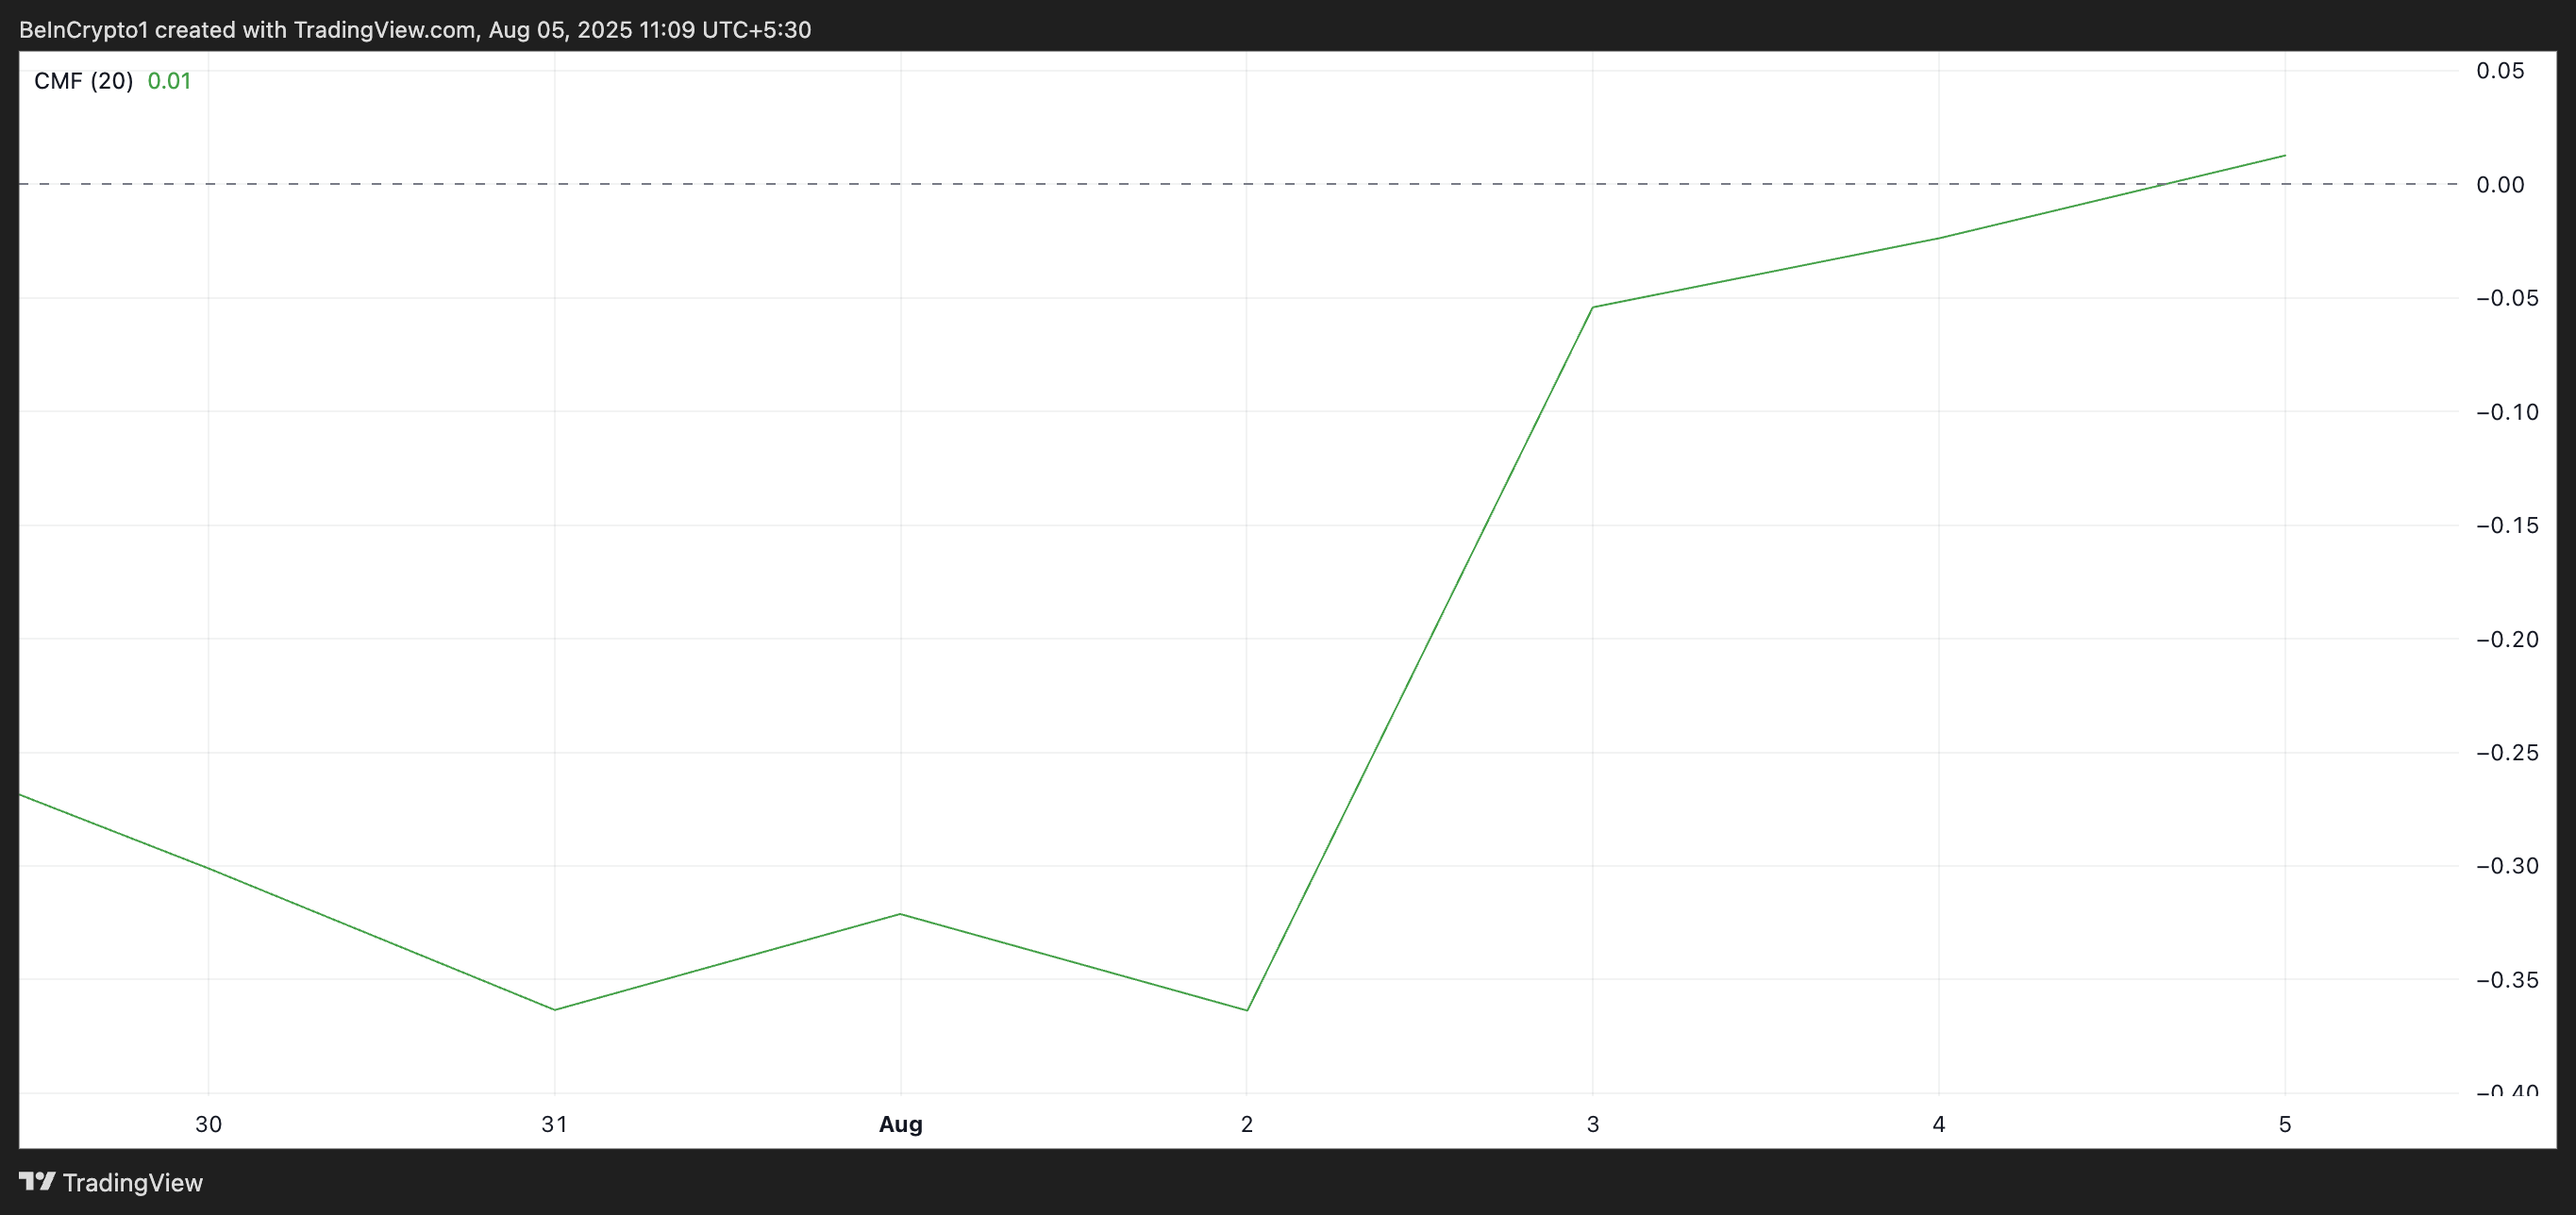
This increase in fund flow may allow M to maintain an upward trend during the next few trading sessions.
Additionally, M is currently trading above the 20-day Exponential Moving Average (EMA), reflecting market buying-side pressure.
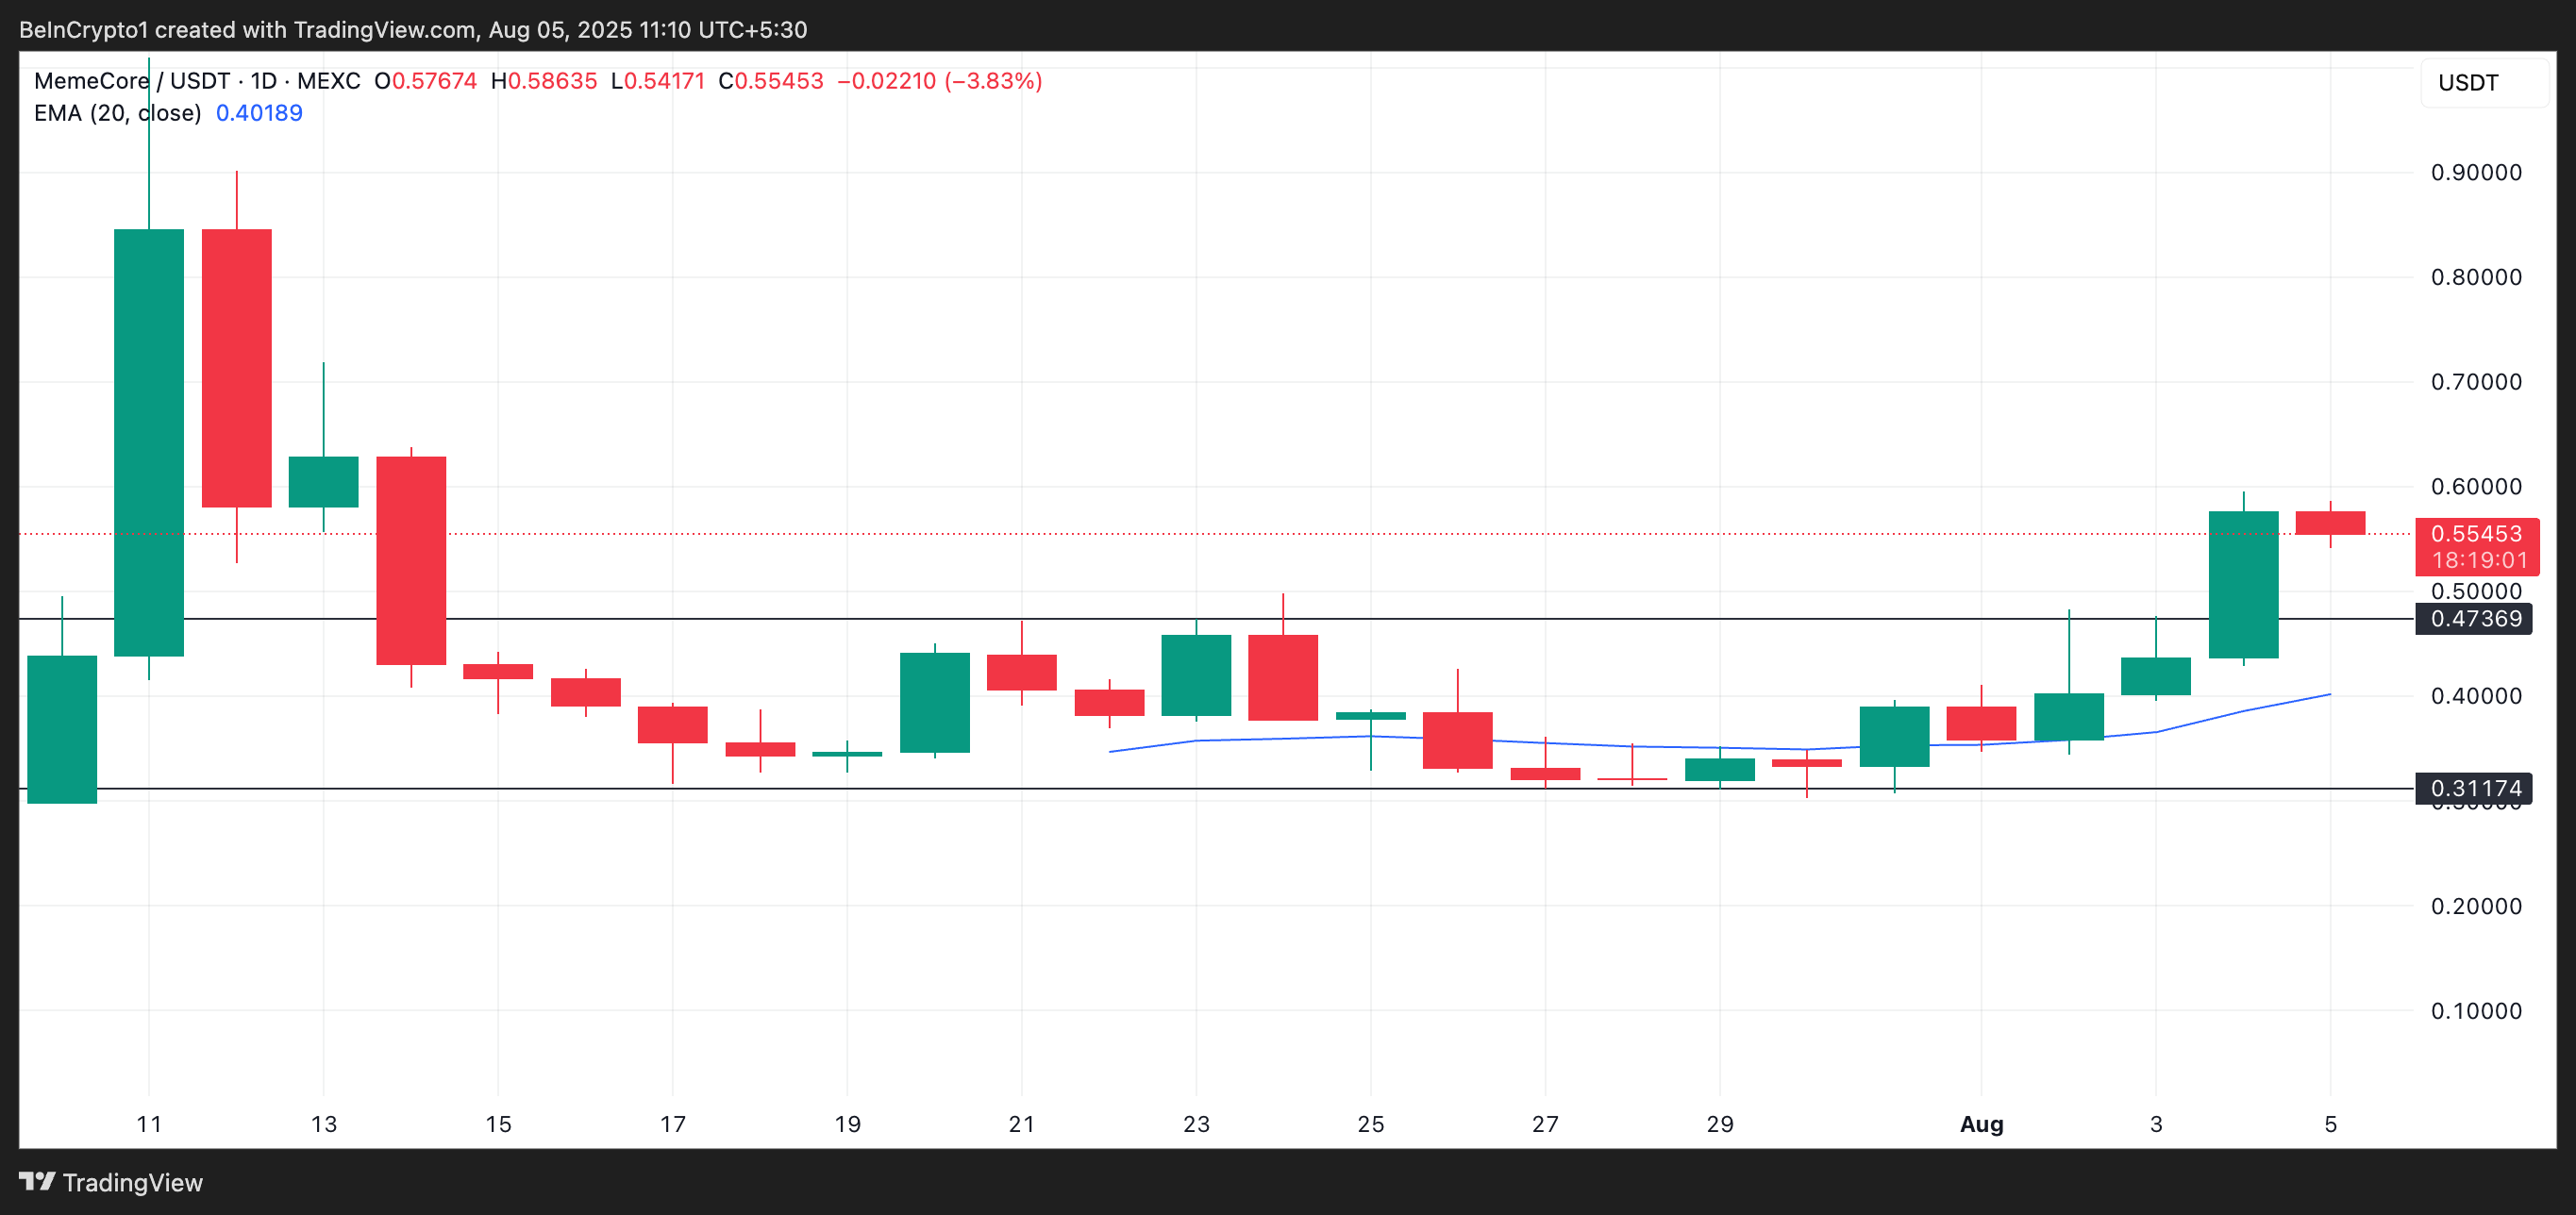
M 20-Day EMA. Source: TradingView
At the time of writing, the major moving average is forming a dynamic support below the coin's price at $0.40. For reference, M is currently trading at $0.55.
The 20-day EMA measures the average price of the asset over the past 20 trading days, with more weight given to recent prices. When the price trades below the 20-day EMA, it indicates increased distribution and weakened short-term support.
Conversely, when the asset's price trades above this level, it suggests an increase in short-term upward momentum, with buyers taking the initiative and potentially driving further gains.
M Breaks Out of Consolidation... Can It Sustain?
The breakout from M's recent sideways pattern indicates a transition from consolidation to a potential upward trend. If accumulation is strengthened, the altcoin's price could rise to $0.63, last observed on July 13.
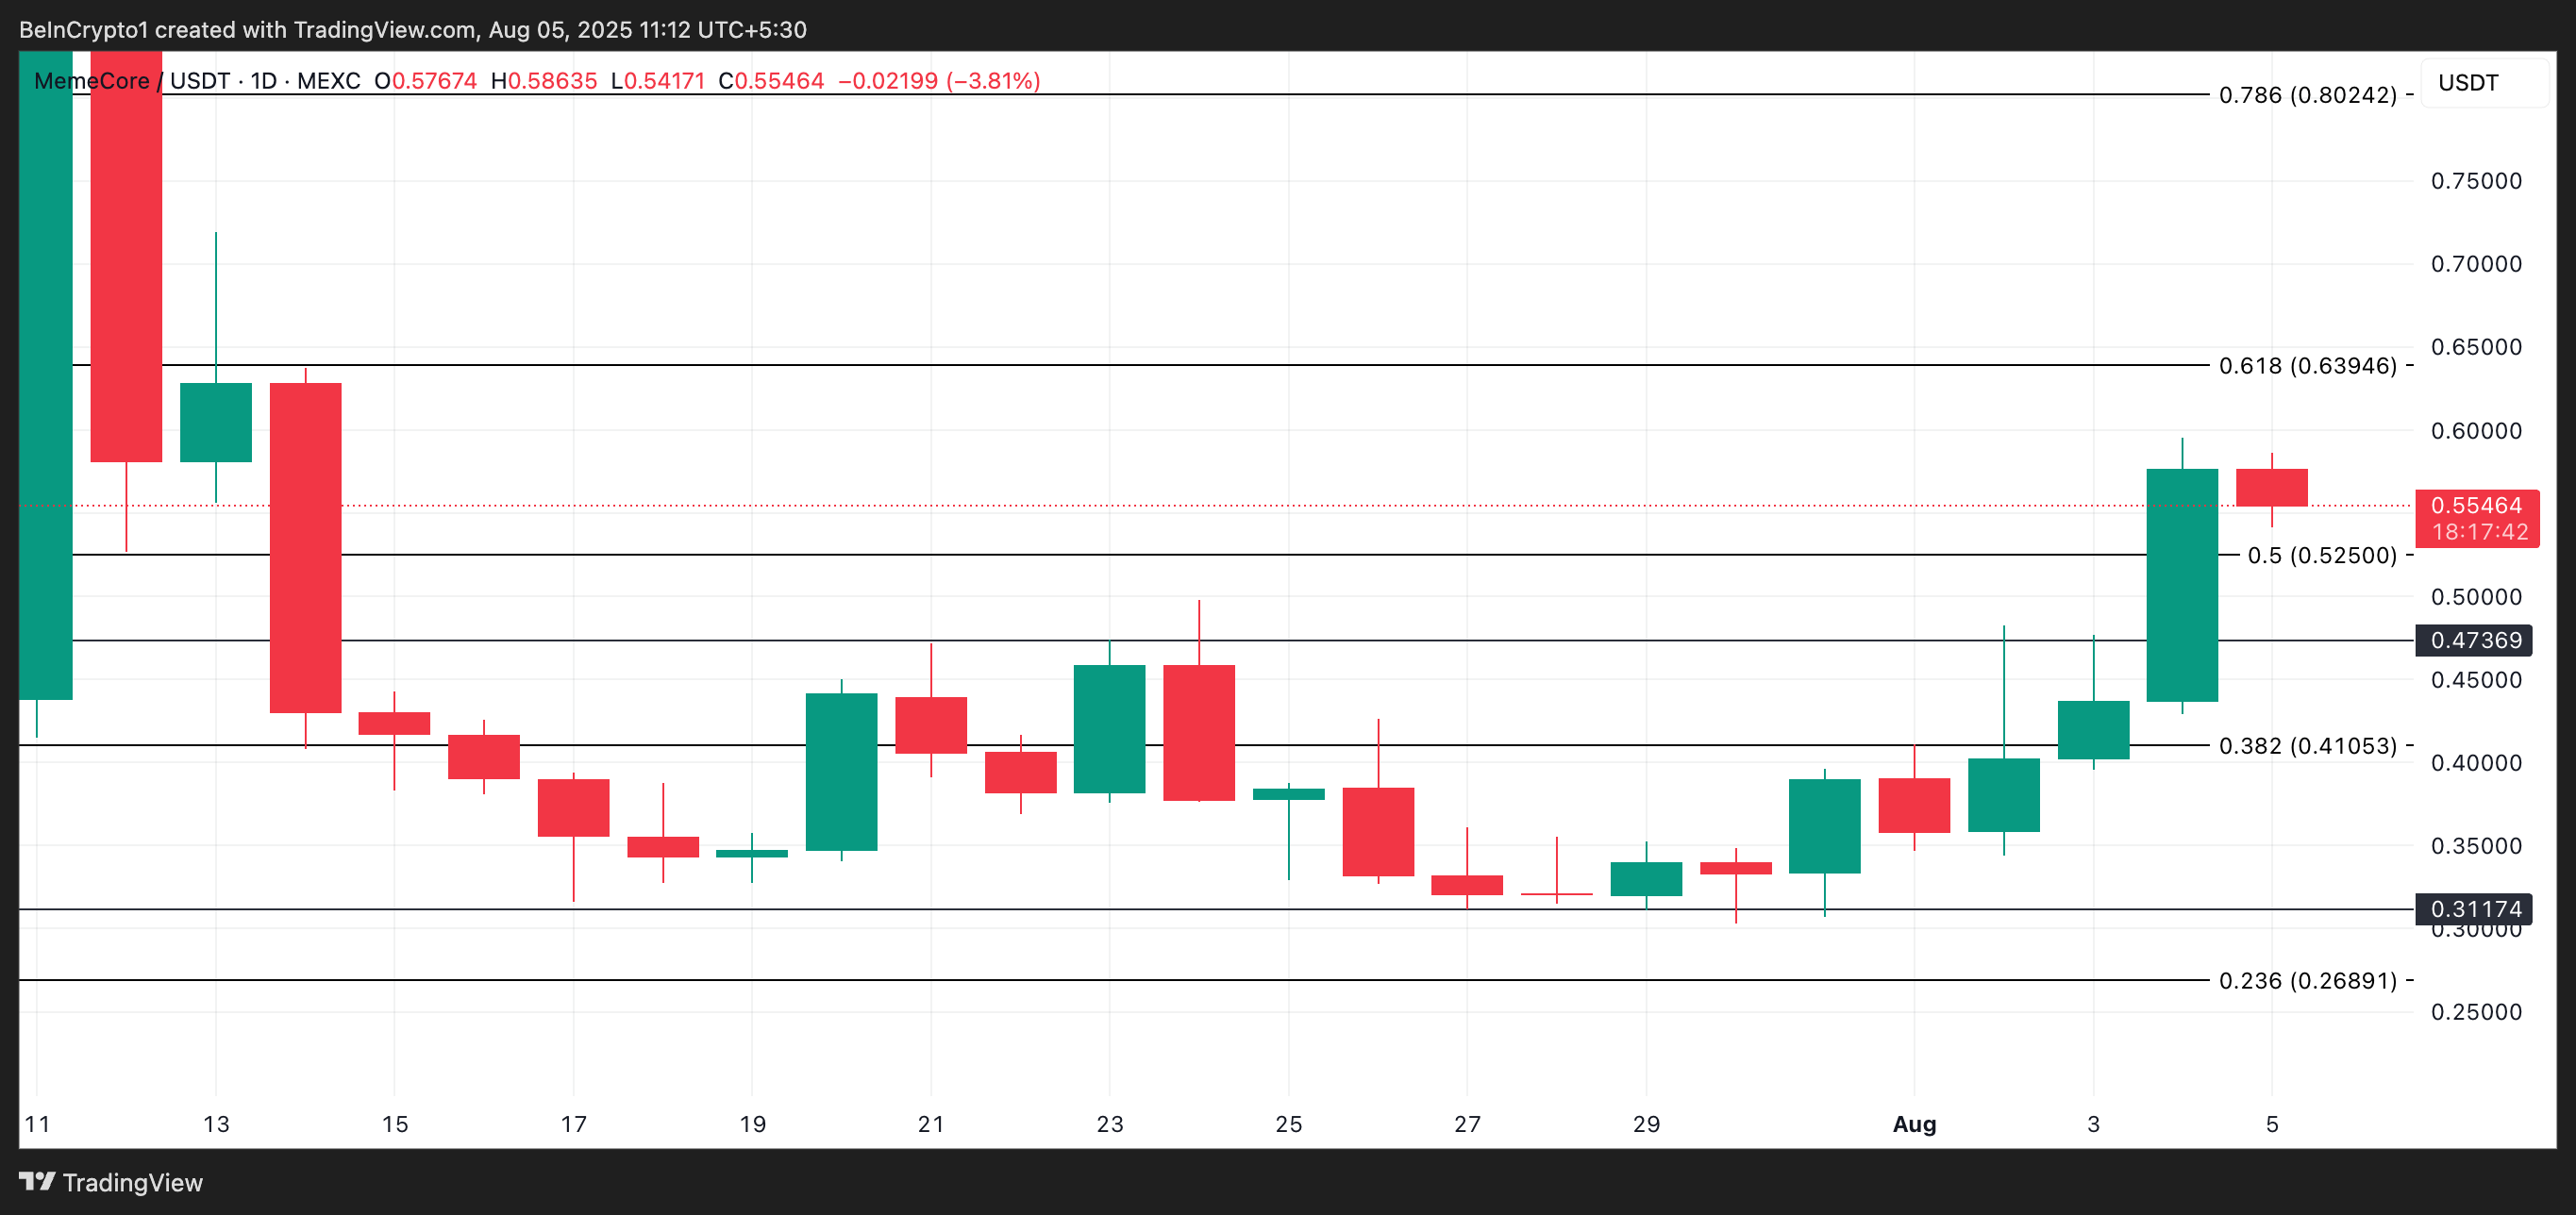
However, this upward outlook will be invalidated if profit-taking activity resumes. In that case, M's price may lose some of its recent gains and fall below $0.52, attempting to return to a narrow range.