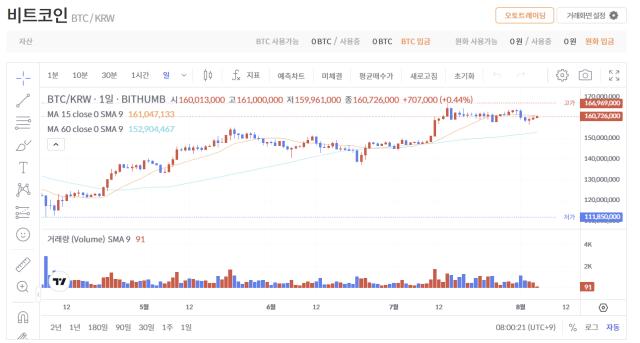
There are many discussions about Ethereum's price. Whether it will break through $4,000 or experience another collapse. In this round, the downward trend seems to be prevalent. Over the past 7 days, $ETH price has dropped by more than 8.6%, currently trading at $3,533, still 27.1% below its all-time high.
However, beneath the surface, the data paints a different picture. Smart money may have already set a trap. Three clear signals and an upward pattern suggest that Ethereum's recent decline could be a downward trend trap.
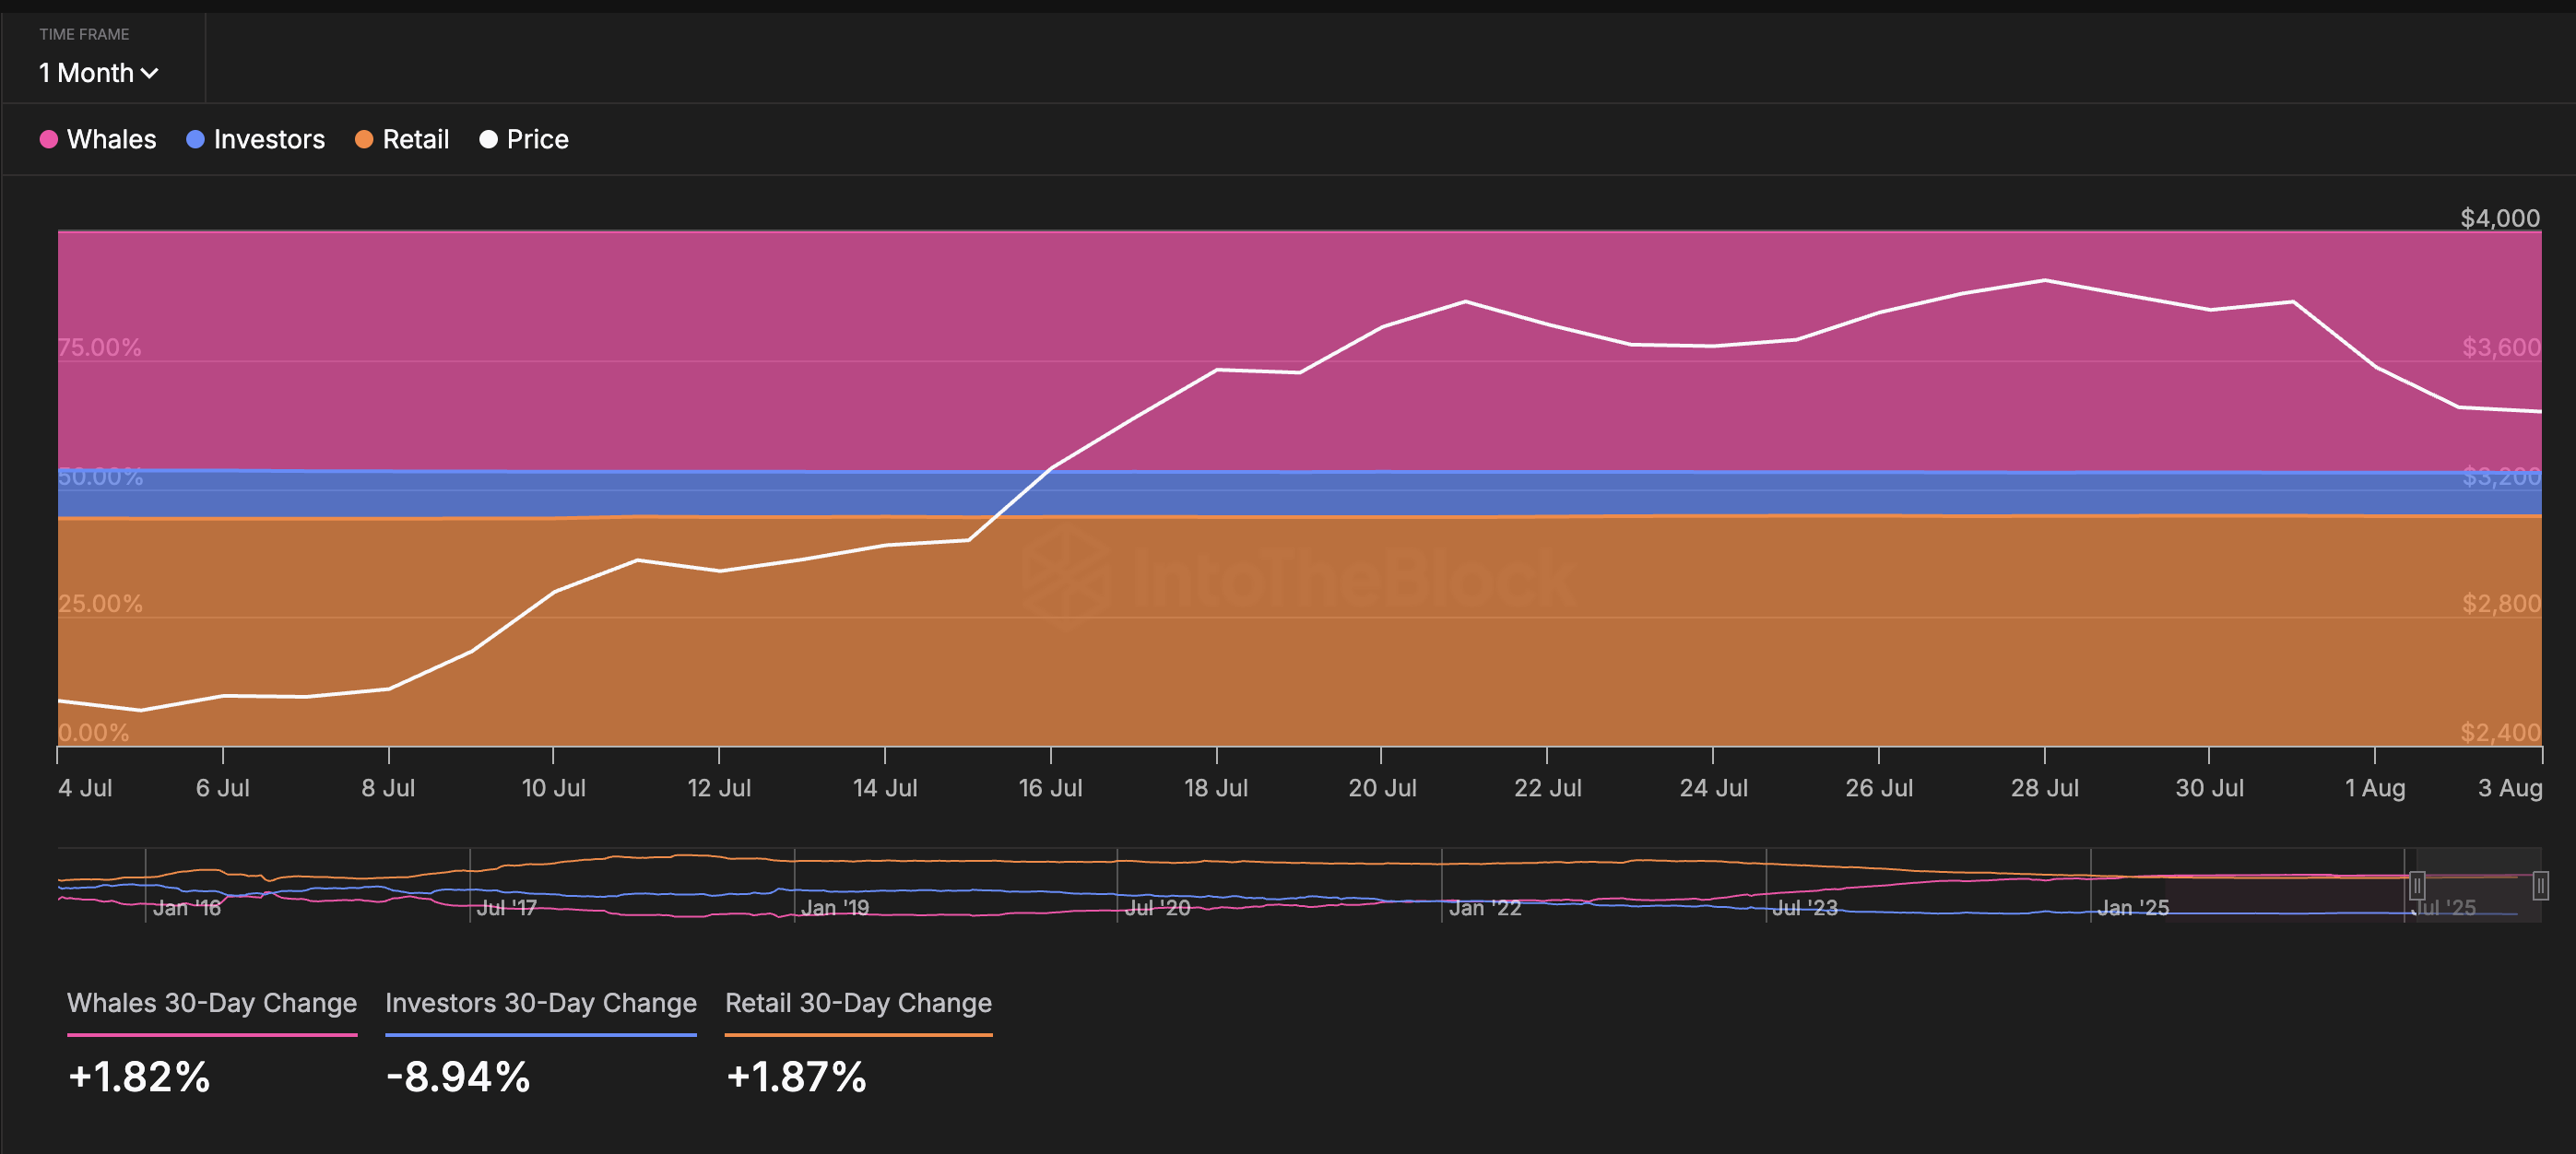
Whale and Retail Concentration Rising... Bullish Reversal
The first signal comes from Ethereum's on-chain concentration indicator. Over the past 30 days, whale holdings increased by 1.82%, and small holders (retail wallets) increased by 1.87%. In most cases, whale movements surpass investor and retail movements due to trading volume.
This time, retail seems to be following $ETH whales, and investors or mid-sized individuals might be falling into a kind of trap.
Interestingly, mid-sized investor wallets are selling, which could imply redistribution to extremes. While whales and retail have very different motivations, both show confidence here.
Reinforcing this perspective is IntoTheBlock's Bull vs Bear address chart. It doesn't use typical sentiment indicators. Instead, it tracks wallet behavior. Buyers are those who bought more than 1% of daily volume, and sellers are those who sold at least 1%.
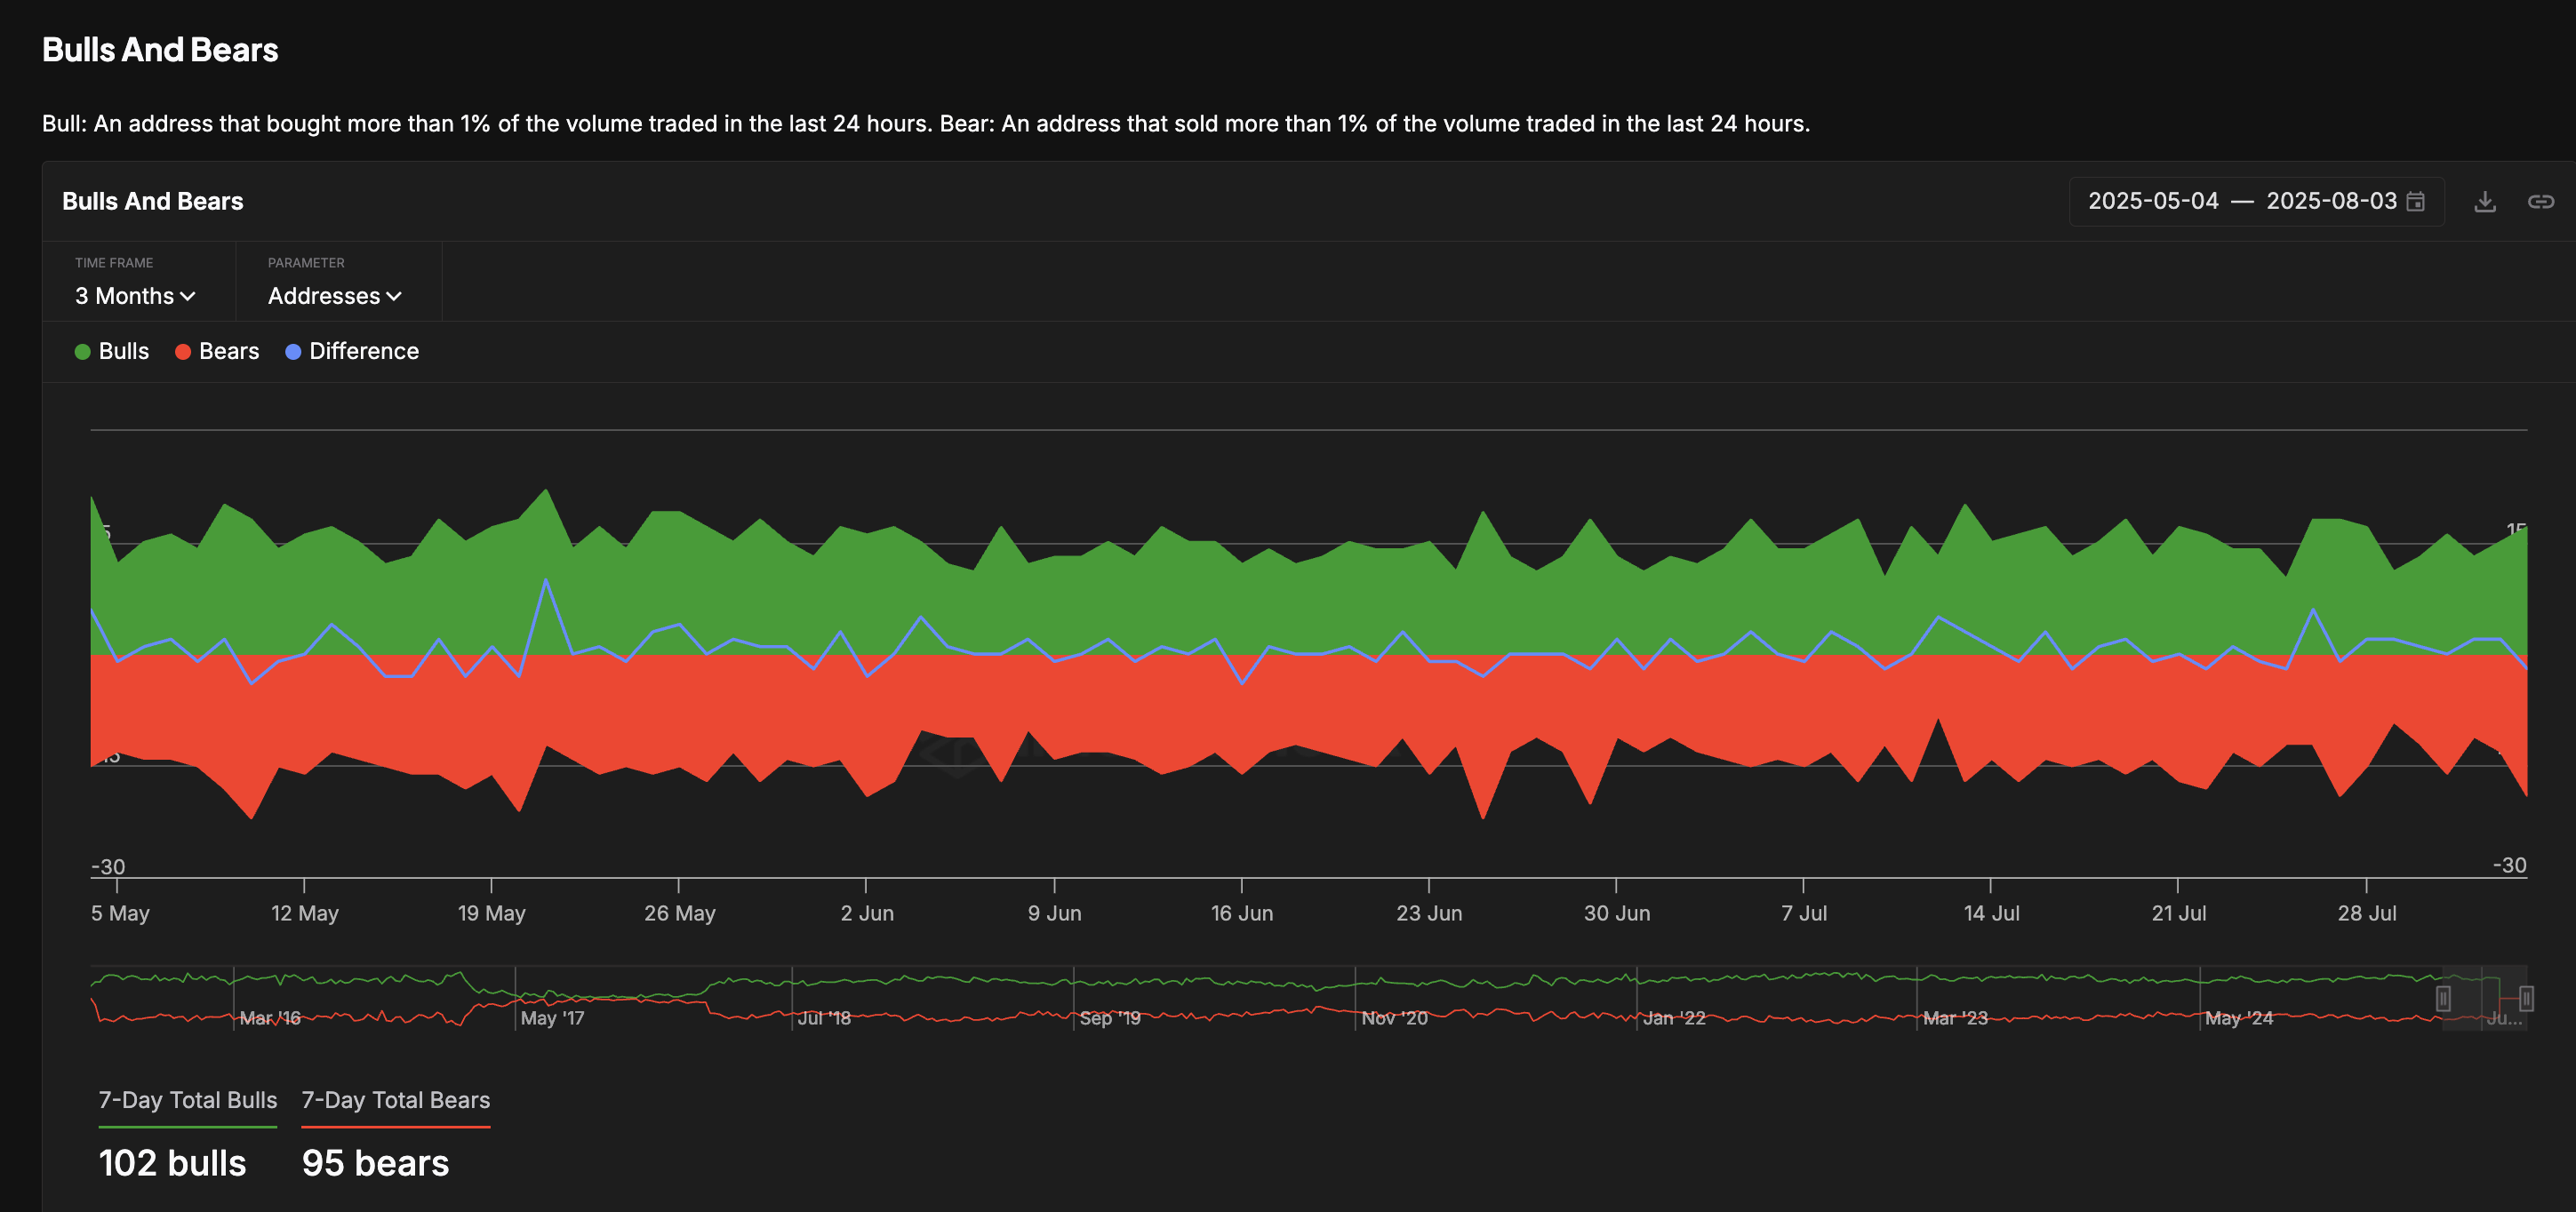
Over the past 7 days, there are 7 more buyers than sellers. This is a subtle difference, but suggests accumulation confidence is stronger than distribution.
Token TA and Market Update: Want more such token insights? Subscribe to editor Harsh Notariya's daily crypto newsletter here.
Long/Short Account Ratio, Traders Bullish
Despite stagnation and frequent declines, traders haven't yet turned bearish. According to Binance's long-short account ratio, Ethereum's indicator is currently 1.91, meaning long accounts are almost twice as many as short accounts.

It's important to note this is not the same as long/short position trading volume ratio. The account ratio measures the number of user accounts holding long and short positions, not just trade size.
This 24-hour data suggests more traders expect continued upward movement, even as price fluctuates near major resistance. Historically, similar ratios have been maintained just before major directional movements.
Ethereum Maintains Ascending Triangle After Testing Major Price Support
The most visually apparent Ethereum price structure is the ascending triangle pattern on the daily chart. After the explosive move from $2,120 to $3,939, Ethereum entered a narrow consolidation range. The 0.236 Fibonacci trend expansion level, or $3,785 price level, attempted to provide support but quickly broke.
Long red candles followed, coinciding with ETH short positions taking center stage. Even ETH selling was reinforced after the decline, with traders assuming the $3,356 support would also break. And that support was briefly tested.
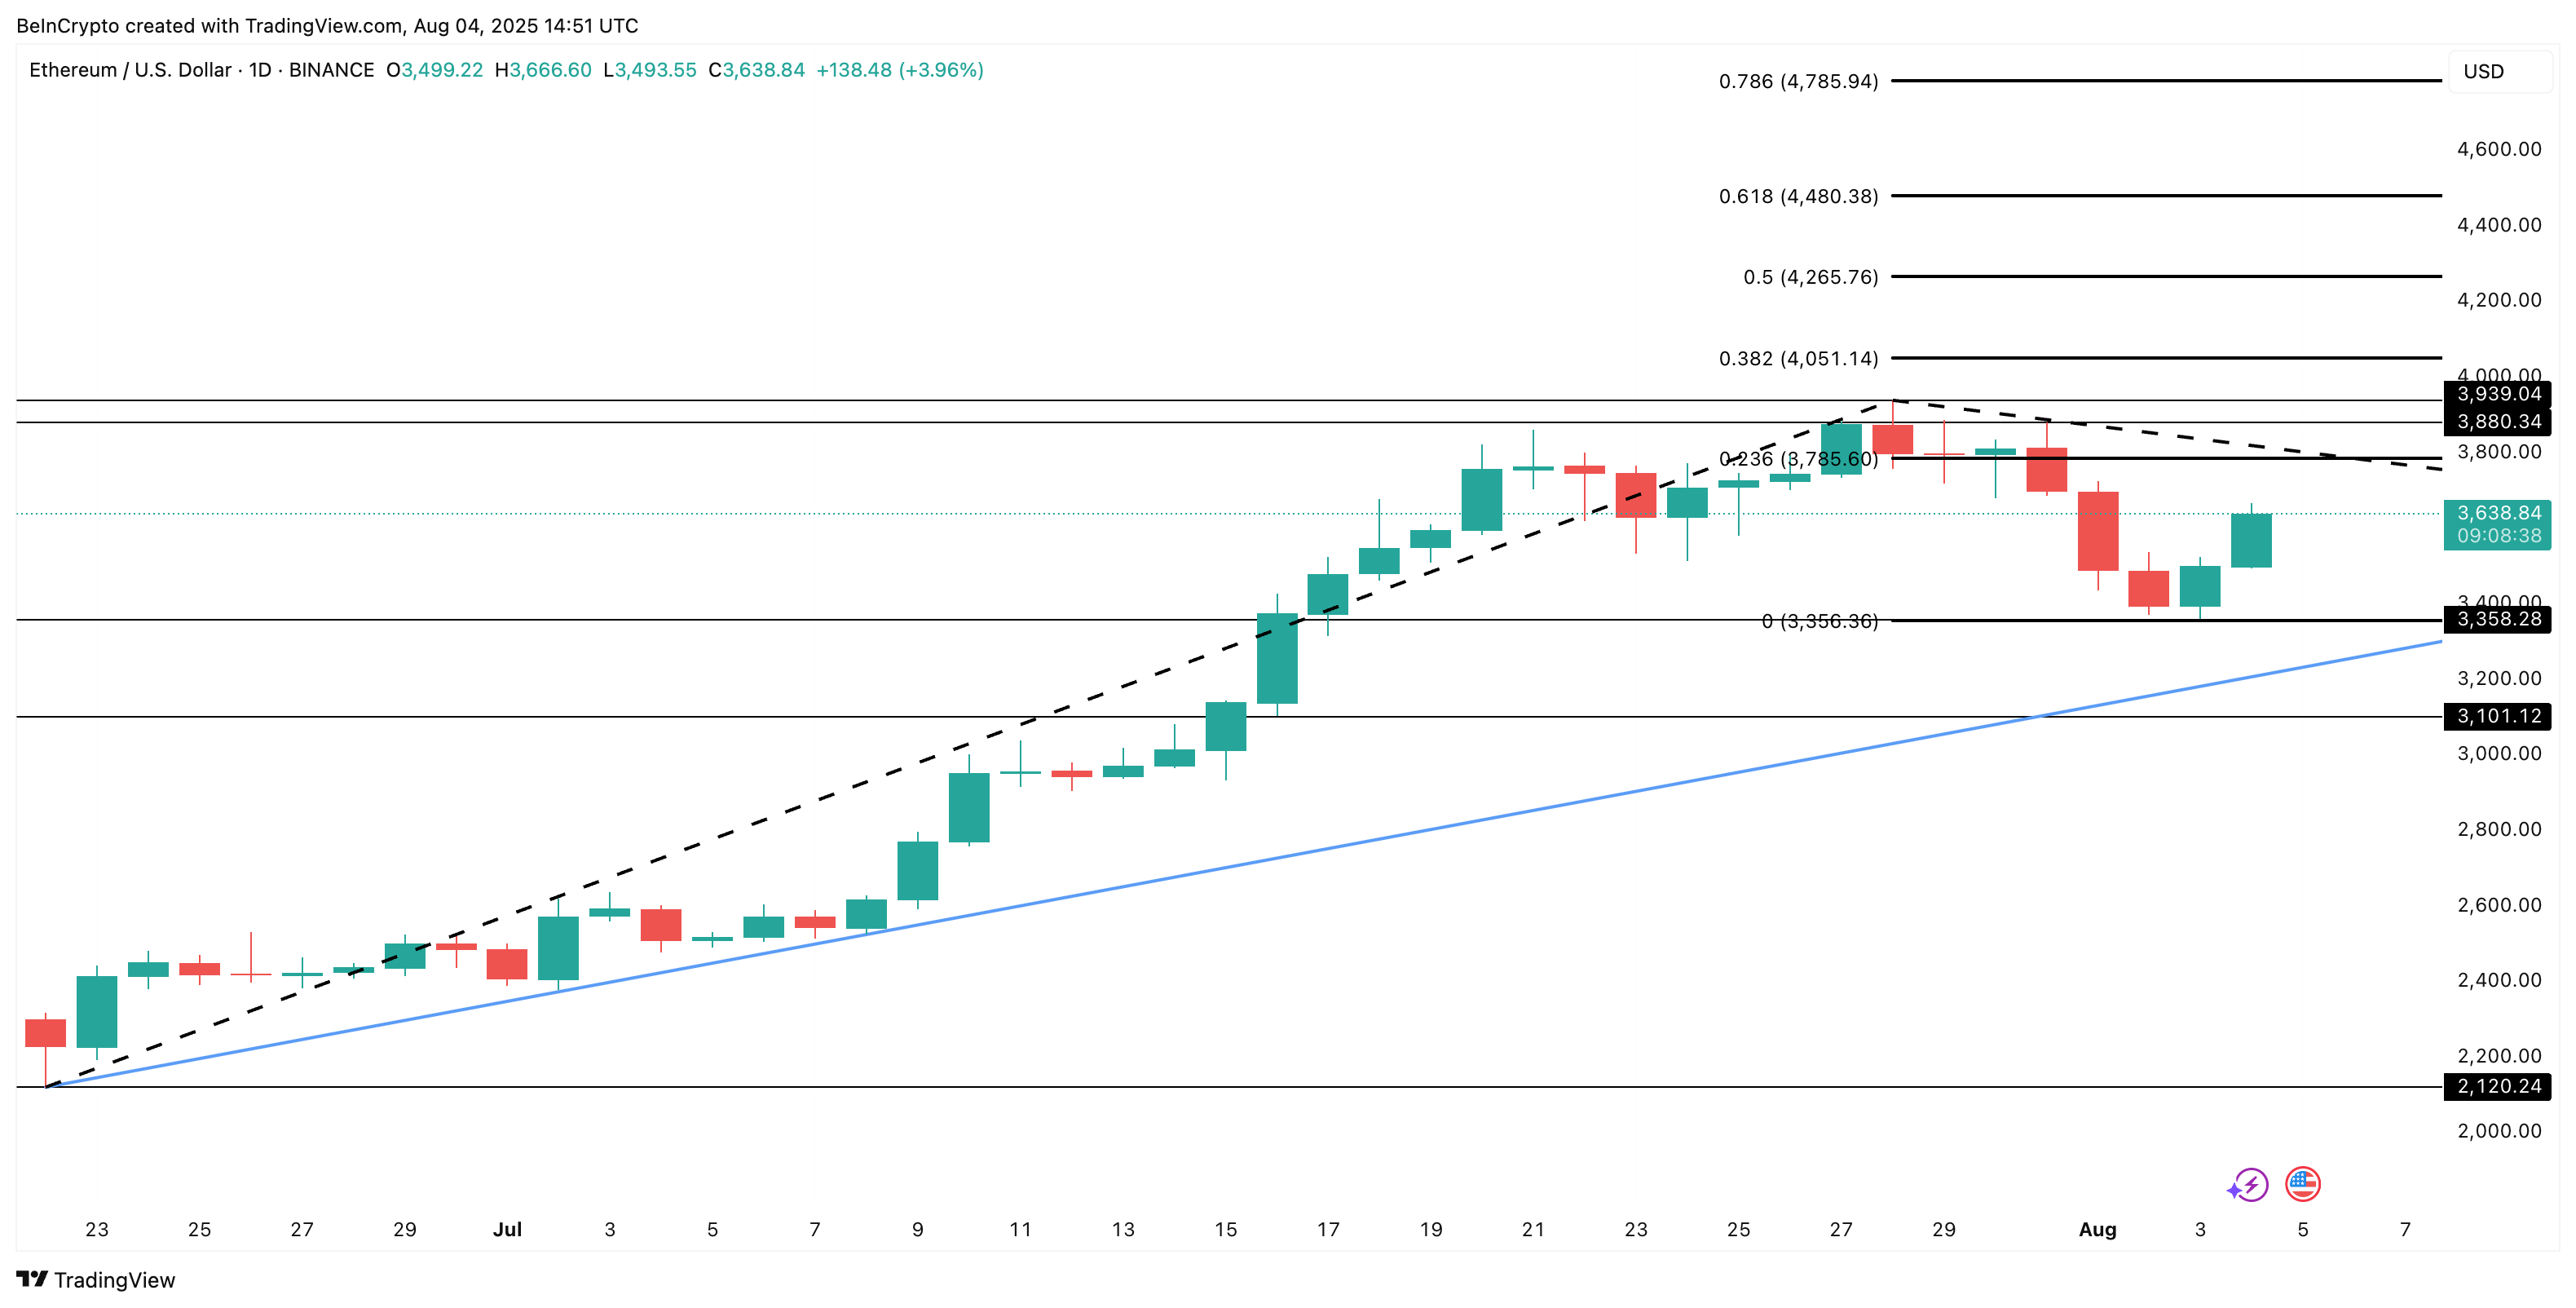
That line was tested yesterday, and smart traders opened short positions. However, the price rebounded, likely liquidating those traders. One fell into the downward trend trap!
It would not be wrong to assume many similar short positions were opened.
Smart trader 0xCB92 is doubling down on his $ETH short!
— Lookonchain (@lookonchain) August 3, 2025
His position has now reached 50,000 $ETH($171.7M) with over $10M in unrealized profit.
Liquidation price: $3,634.https://t.co/PqrRRV3sXQ pic.twitter.com/vJDZBpUiFL
However, if the daily candle closes above $3,785, $ETH price could have the strength to test $3,939, and a subsequent move to $4,051 would be considered a clear breakout.
But if the major support at $3,356 ultimately breaks, the bullish hypothesis becomes invalid.