The price of Ethereum, a major altcoin, is moving further away from $4,000. Recently, ETH's price has significantly dropped from its July high of $3,941 as recent profit-taking and a cautious market sentiment have greatly impacted market momentum.
On-chain and technical indicators suggest an increasing likelihood of falling below $3,000 in the coming weeks.
ETH, Accumulation Decreases... Weakness Signals Increase
According to Glassnode data, Ethereum's holder accumulation ratio reached a two-month low of 27.57% on Saturday. This indicates that investors are no longer actively increasing their ETH holdings.
Want more of these token insights? Subscribe to the daily crypto newsletter by Editor Harsh Notariya here.
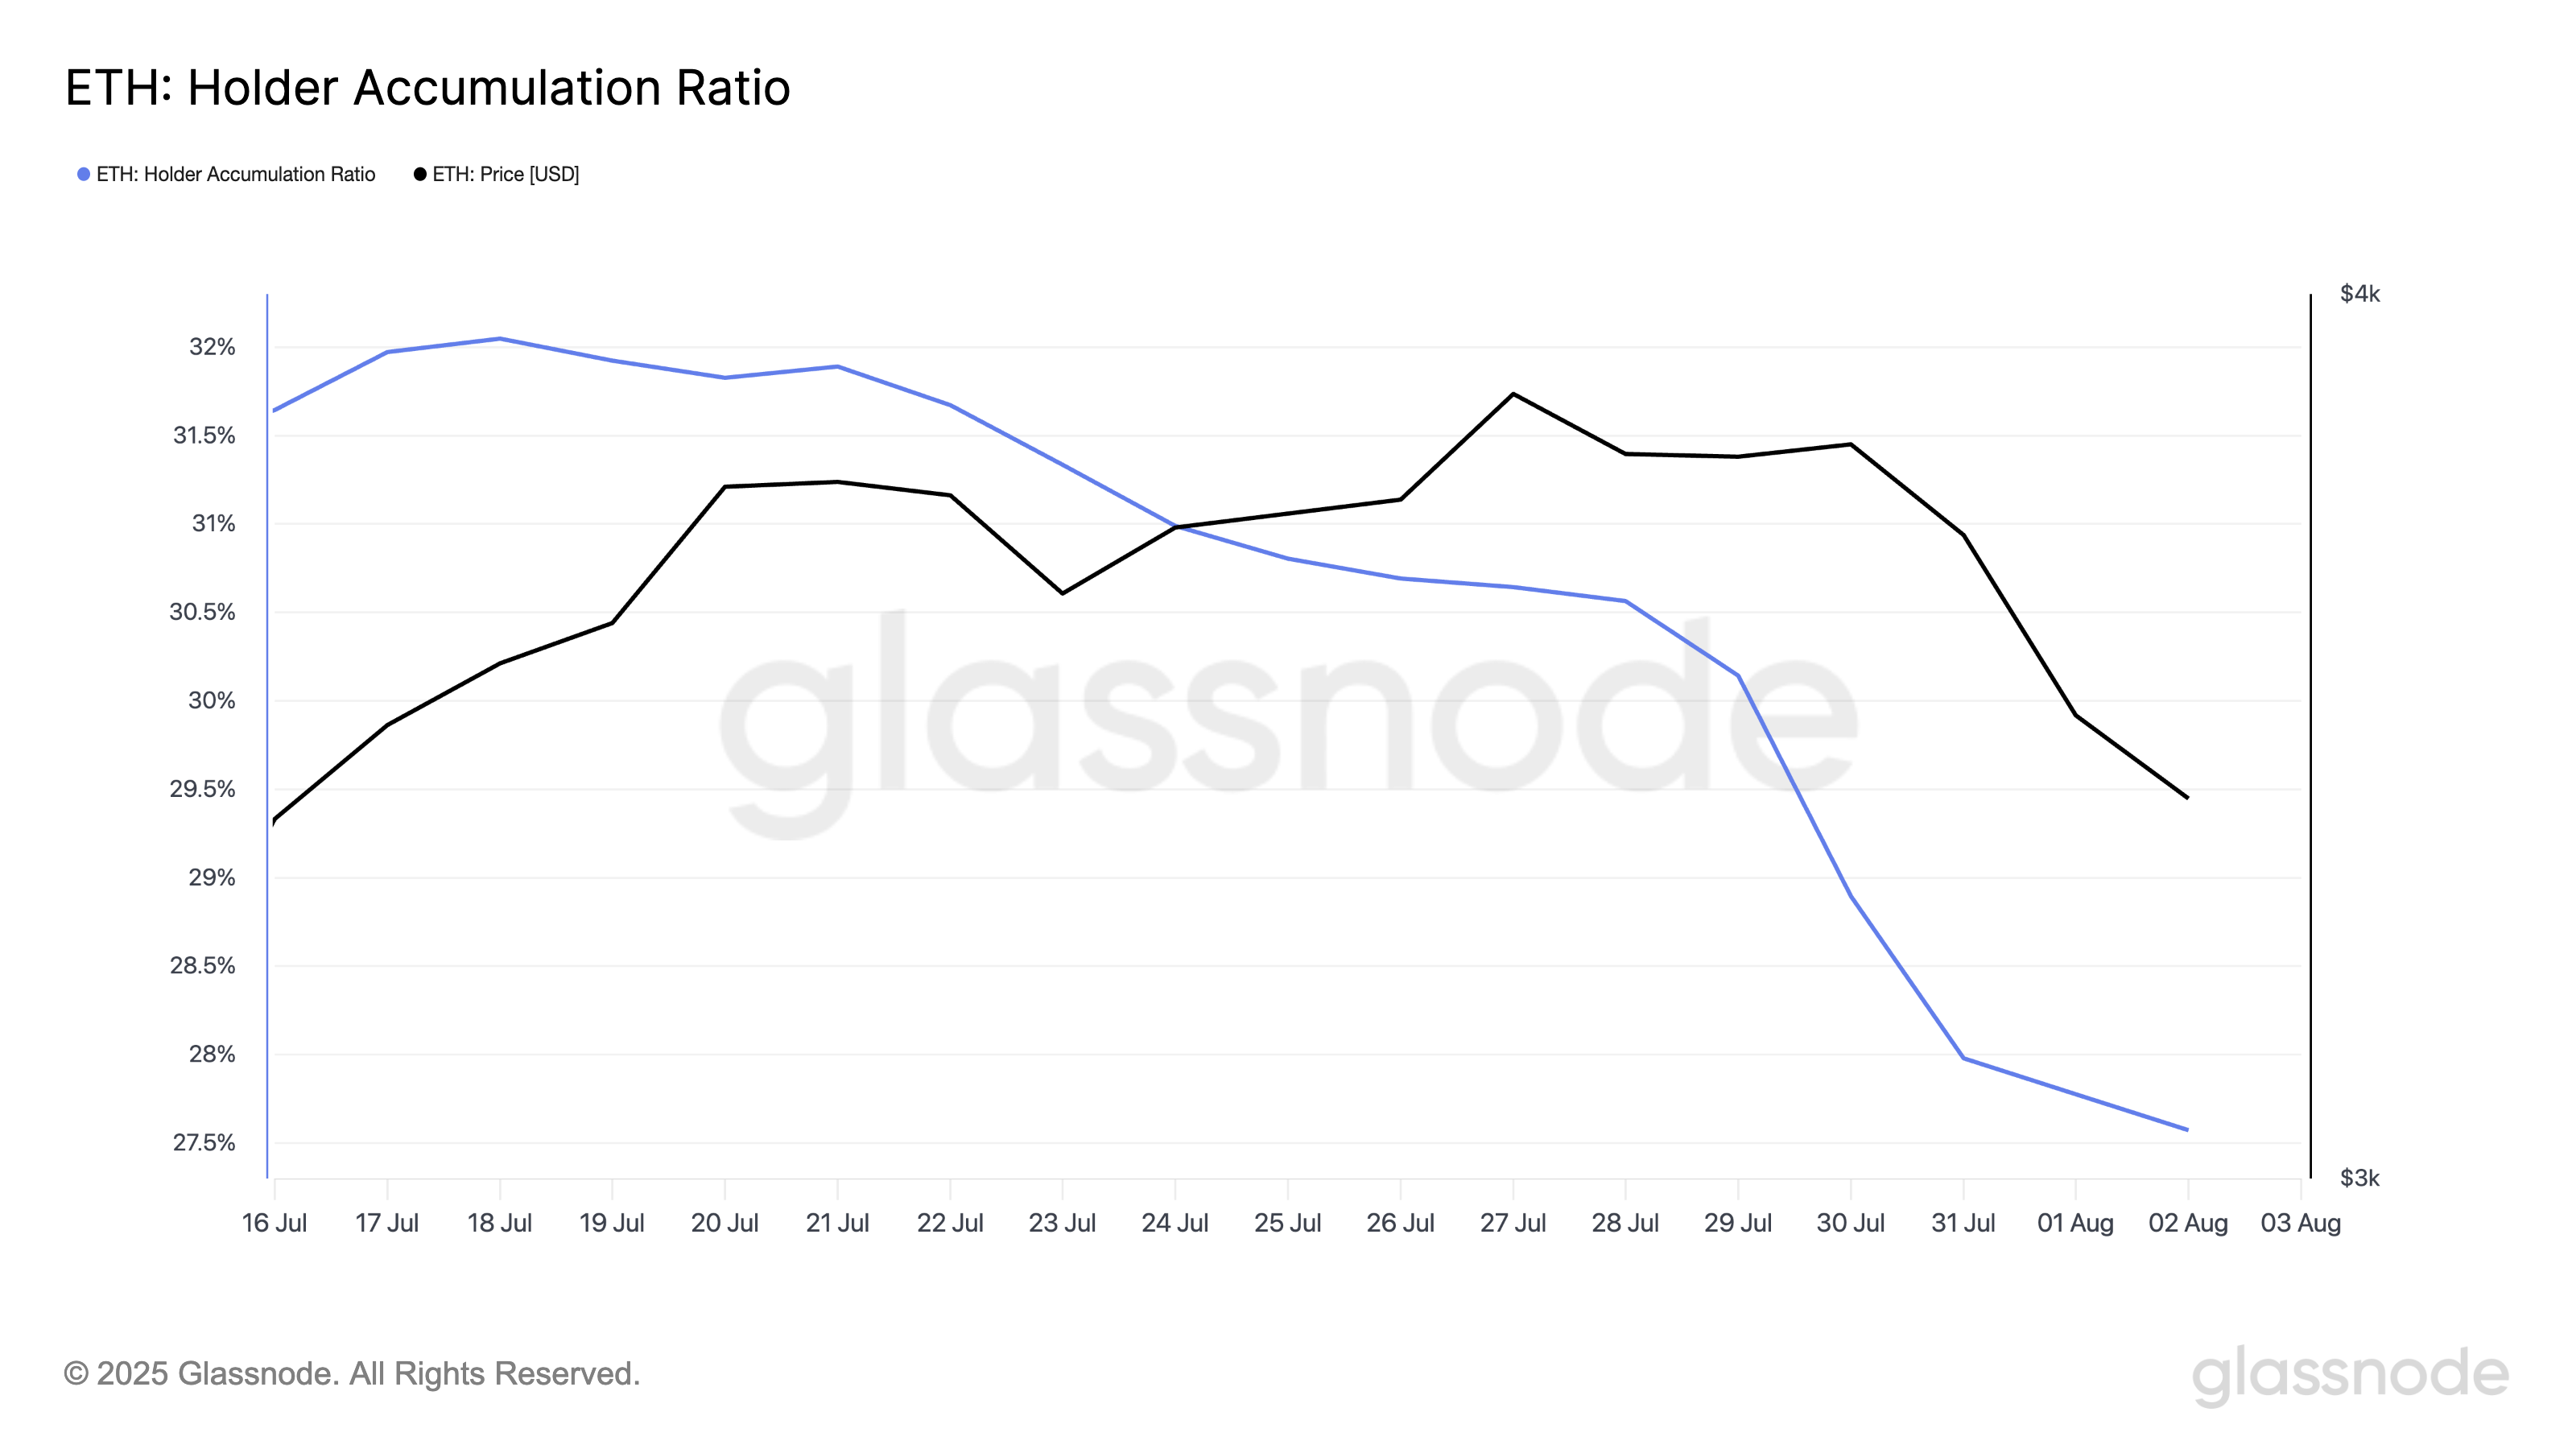
According to the on-chain data provider, this indicator measures the percentage of existing addresses increasing their ETH balance.
When this indicator rises, it typically represents accumulation behavior seen in a bullish market with high confidence in price increases.
Conversely, as currently observed, a falling ratio indicates weakening confidence and hesitation to buy during downturns. The less holders accumulate, the less buying pressure ETH has to maintain a rebound.
Moreover, ETH's Elder-Ray index has recorded red histogram bars over the past three trading days. This confirms that bears are overtaking bulls, currently positioned at -342.73.
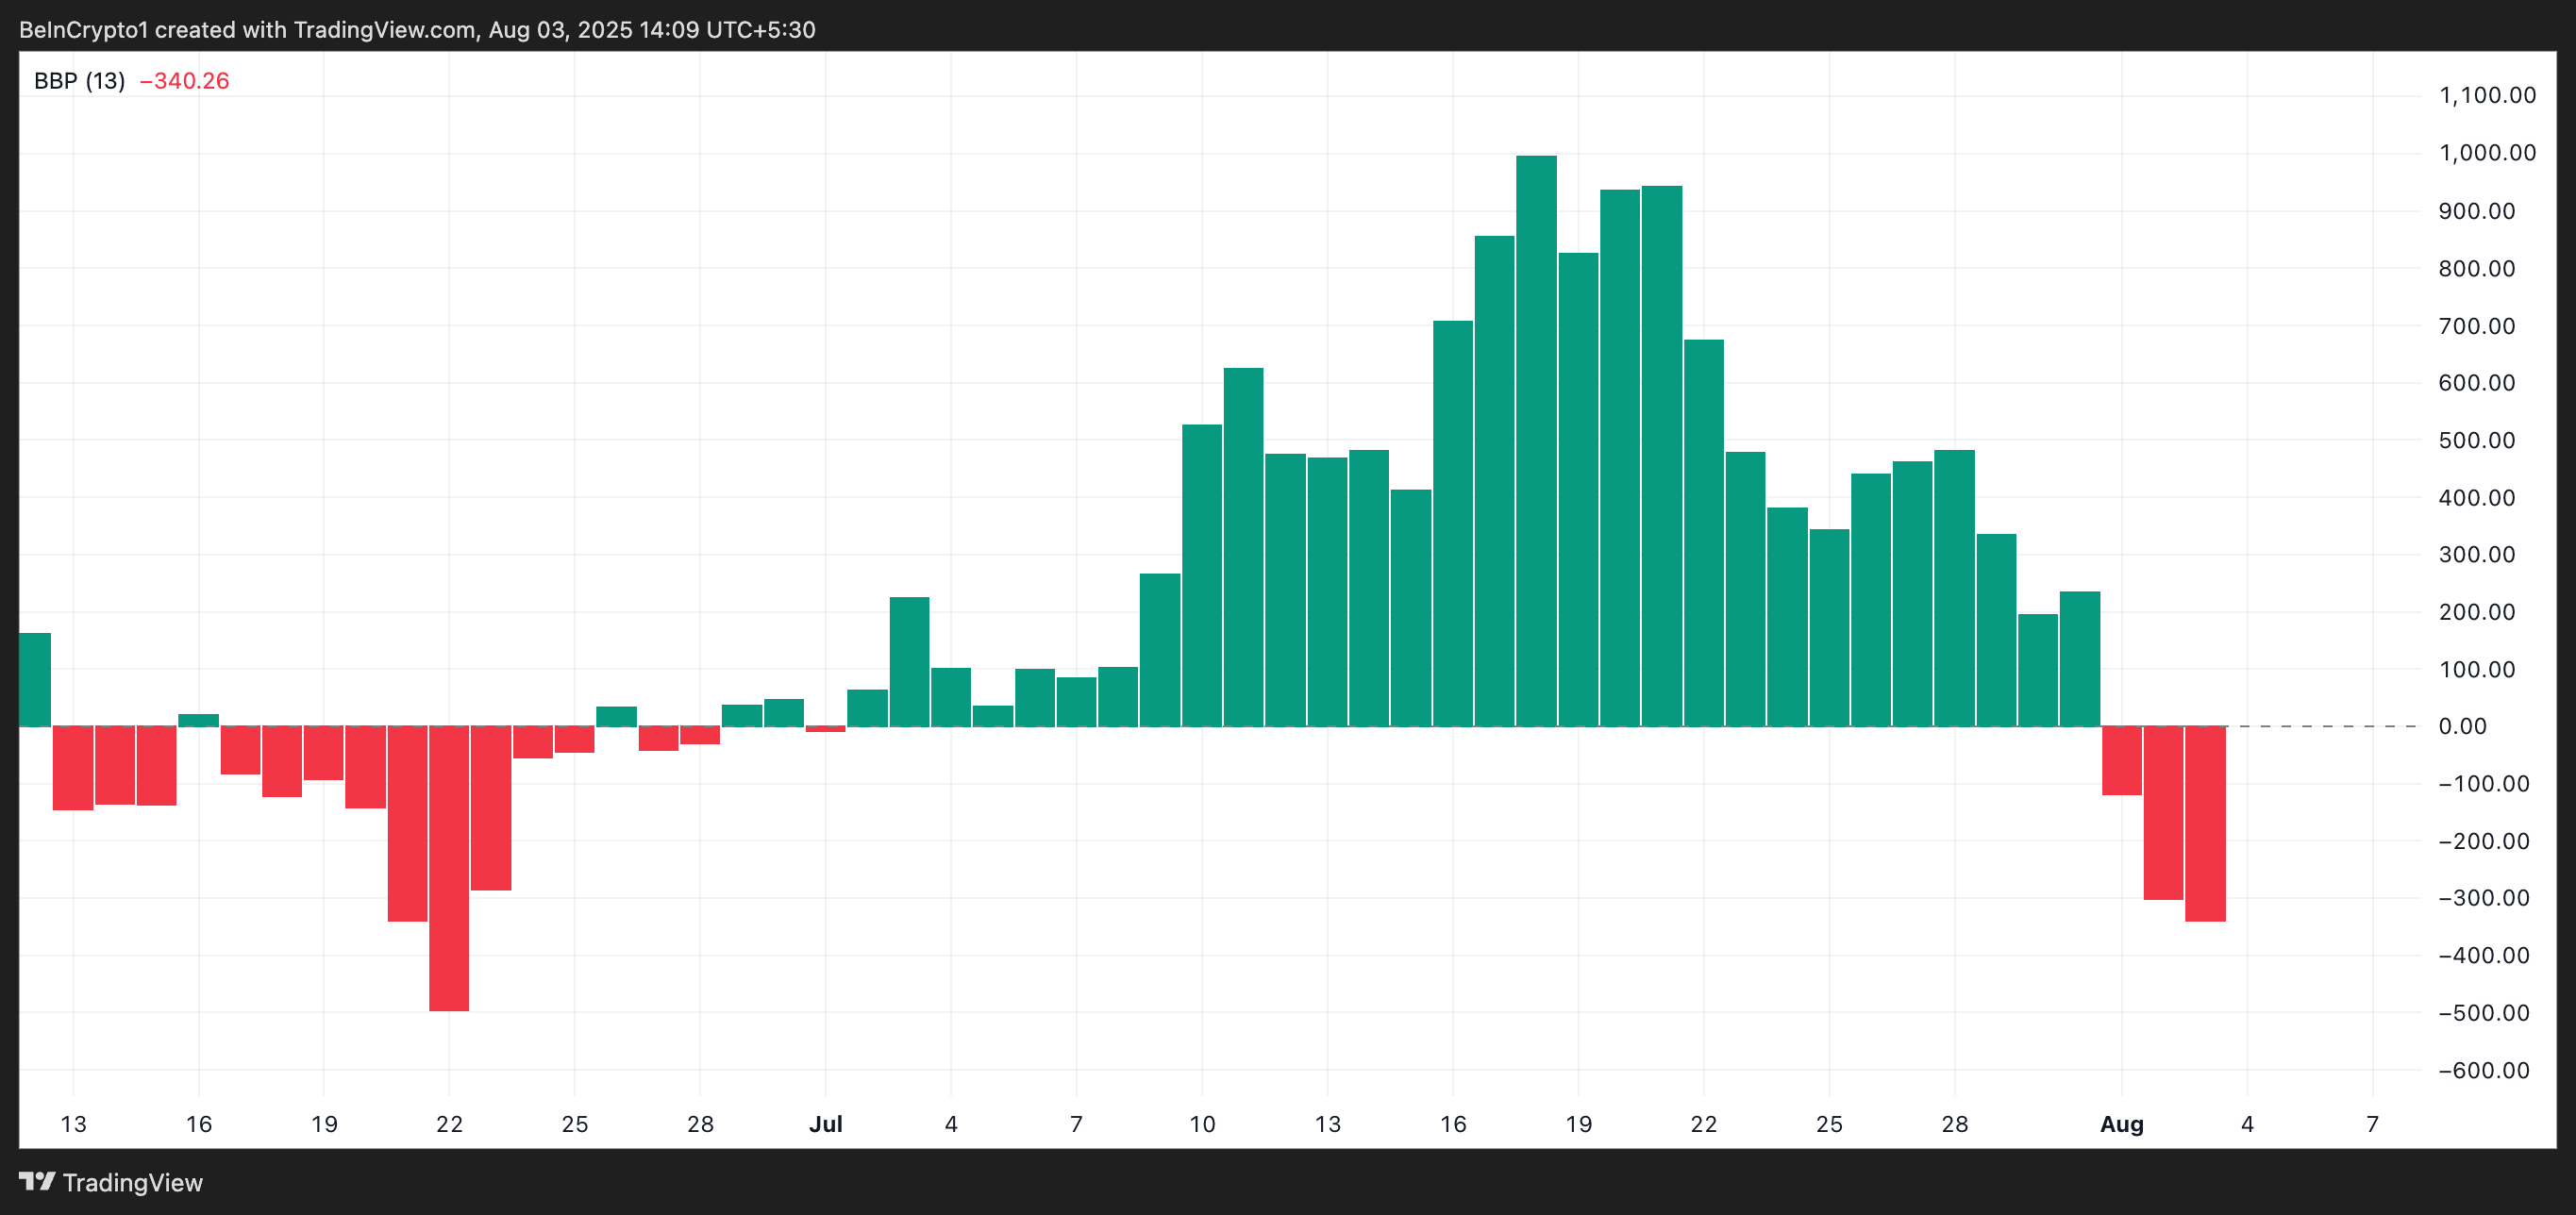
This indicator measures the strength of bulls and bears in the market. Green histogram bars indicate strong buyer dominance and upward momentum.
Conversely, when bear momentum grows like with ETH, red bars appear and continue to increase. These red bars indicate not only the existence of selling pressure but also its growth over time.
ETH Eyes $2,745... Buyers Retreat
ETH is currently trading at $3,457, just below a major resistance level at $3,524. With weakening accumulation, the downward momentum could pull the price to the next major support level at $3,067.
If this support level breaks, ETH could fall further to test the $2,745 zone.
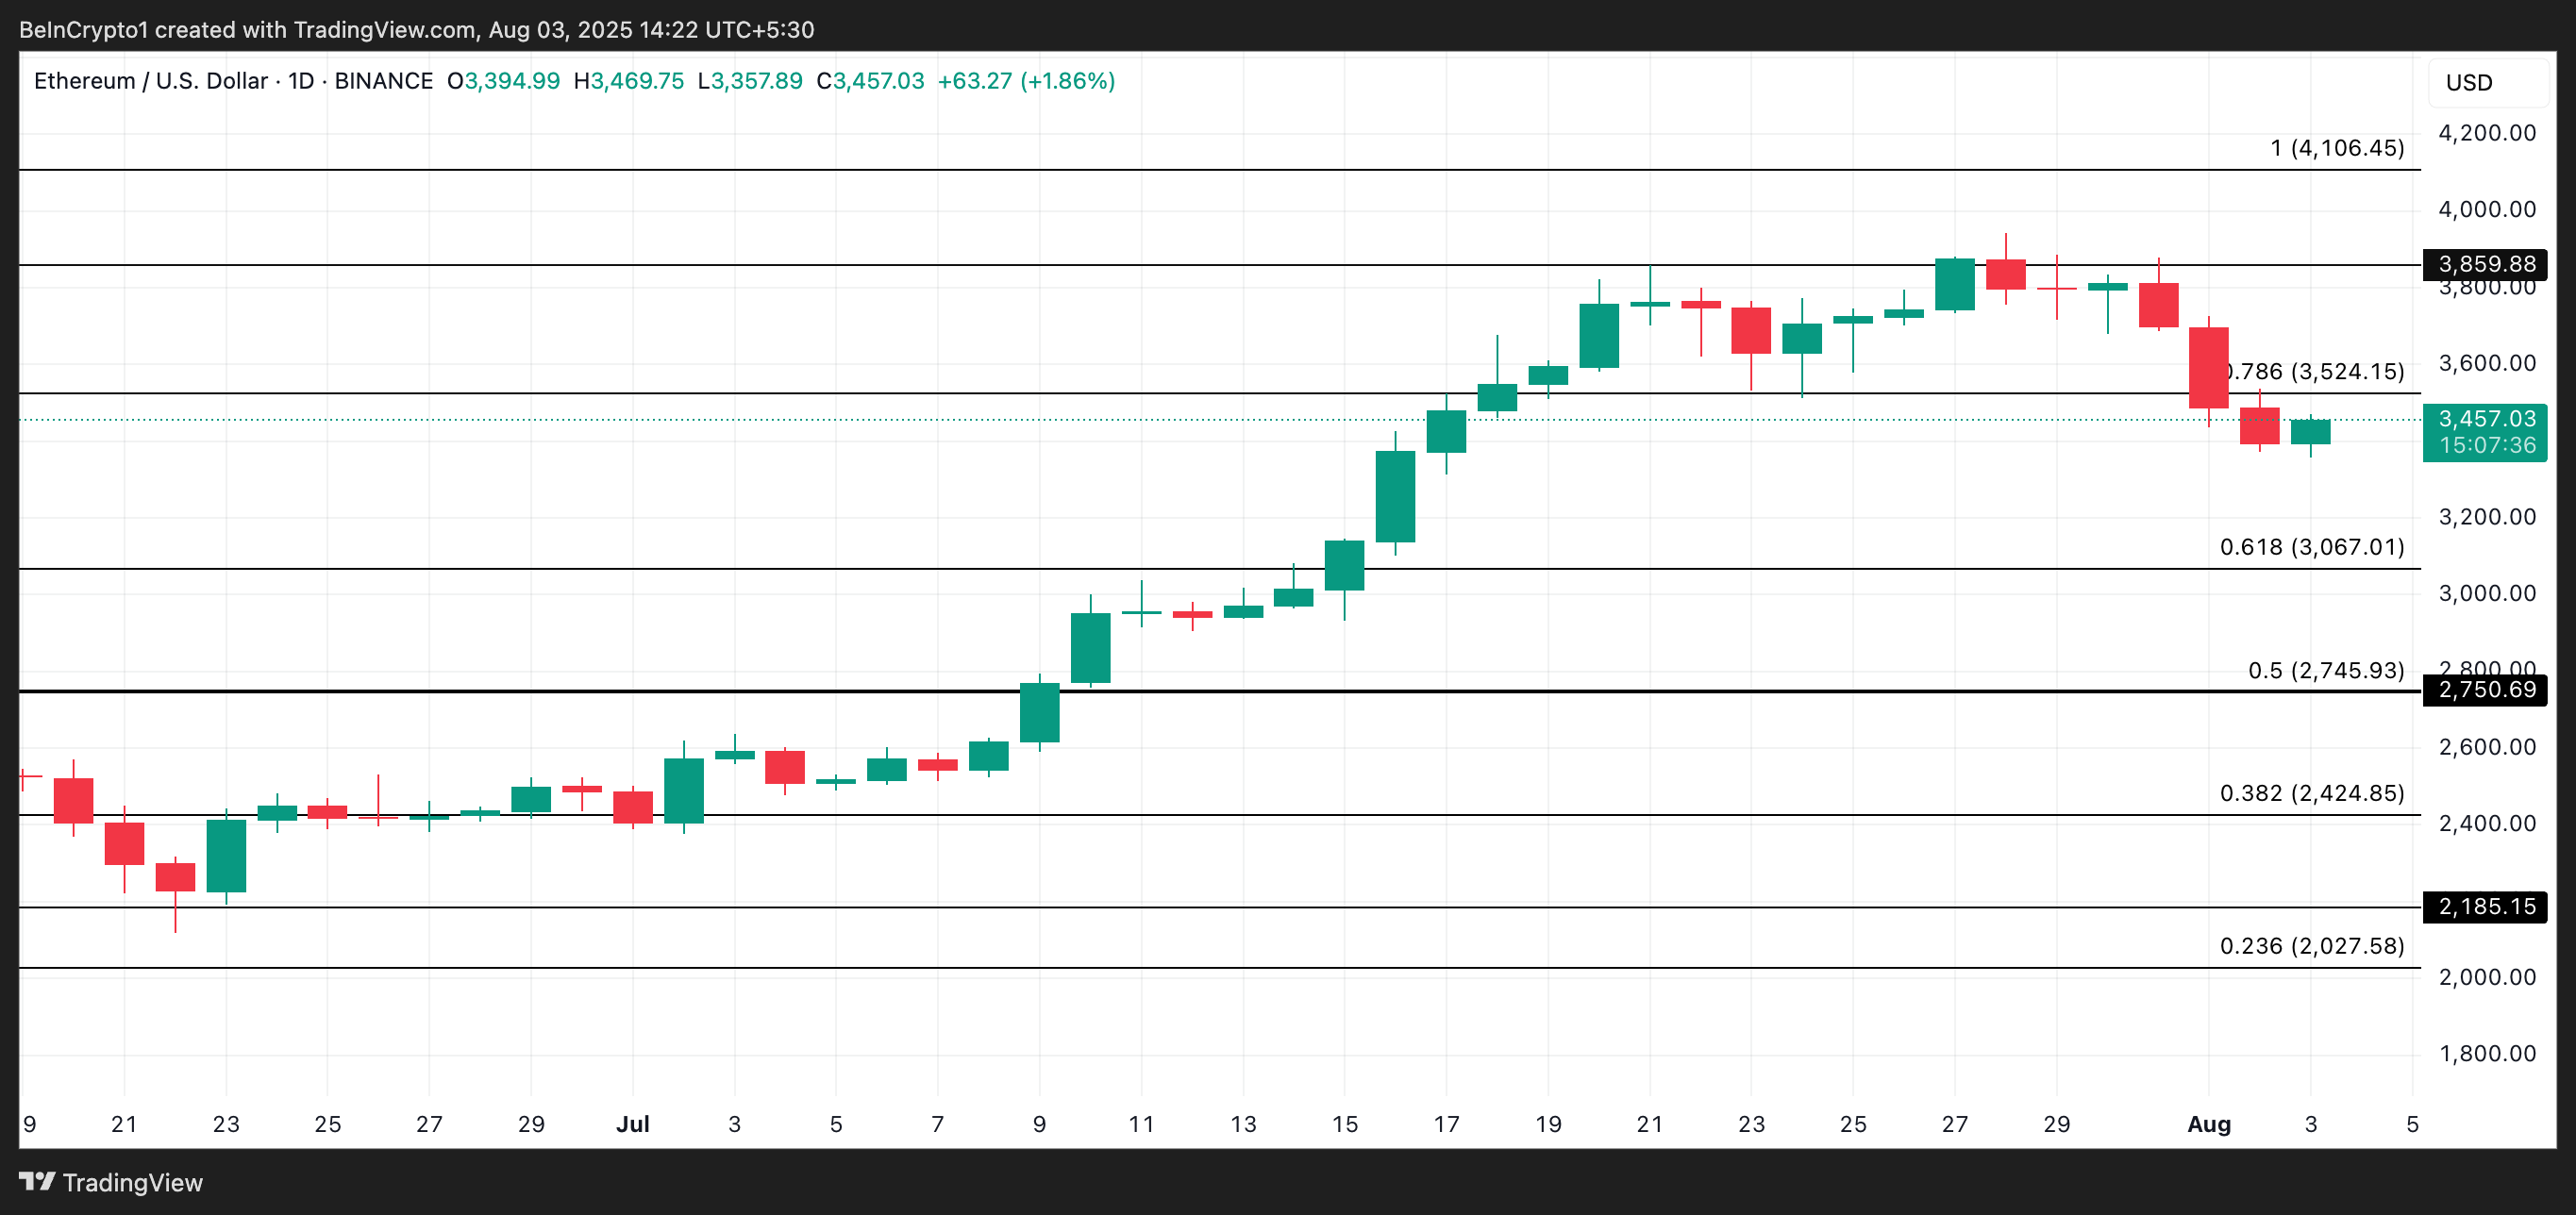
Conversely, a new wave of demand could change the mood and promote recovery. In this case, ETH might attempt to break through the $3,524 resistance again. A successful breakthrough could pave the way for an extended rally to the $3,859 level.