

Solana reaffirmed its position as a strong large-cap altcoin, riding the broad market uptrend in July. Closely tracking Bitcoin's upward momentum, SOL surpassed $200 on July 22nd, reaching a cycle high of $206.19.
This price increase triggered a surge in on-chain activity across the Solana ecosystem, increasing DeFi Total Value Locked (TVL), DEX Volume, and overall chain revenue. However, signs of fatigue began to emerge. SOL dropped below $190, facing selling pressure suggesting investors are exiting after locking in July's gains.
SOL Rally Boosts Network…Will August Momentum Continue?
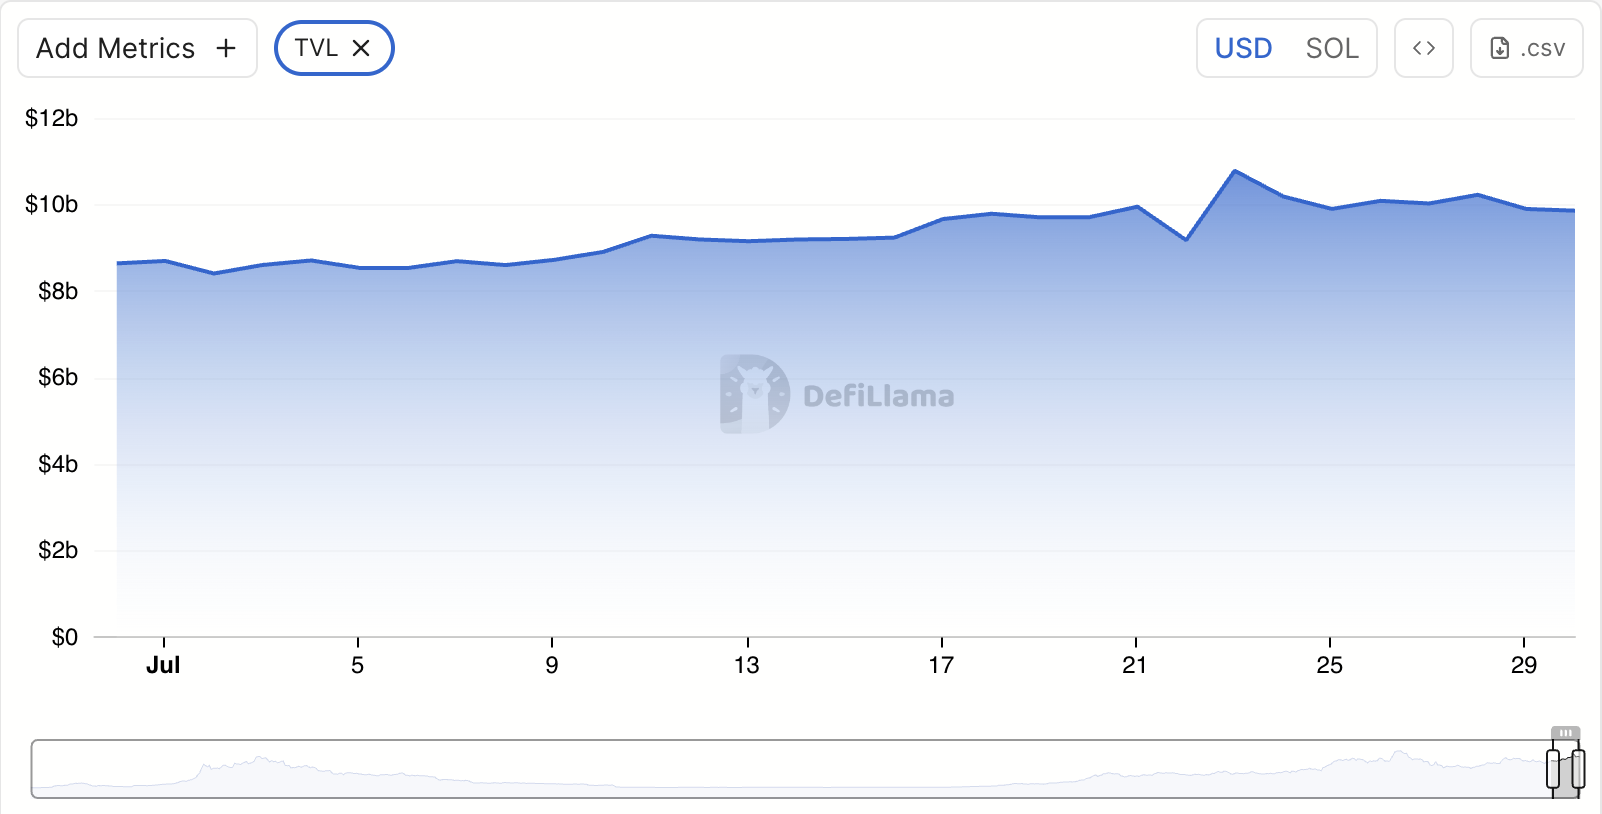
From July 1st to July 22nd, SOL maintained a steady uptrend, increasing its value by 40%. As SOL's price surged, the on-chain value of tokens locked in lending pools and vaults across the Solana network increased, boosting the network's TVL.
At the time of reporting, Solana's TVL reached $9.85 billion, a 14% increase from the previous month.
Token TA and Market Update: Want more such token insights? Subscribe to editor Harsh Notariya's daily crypto newsletter here.
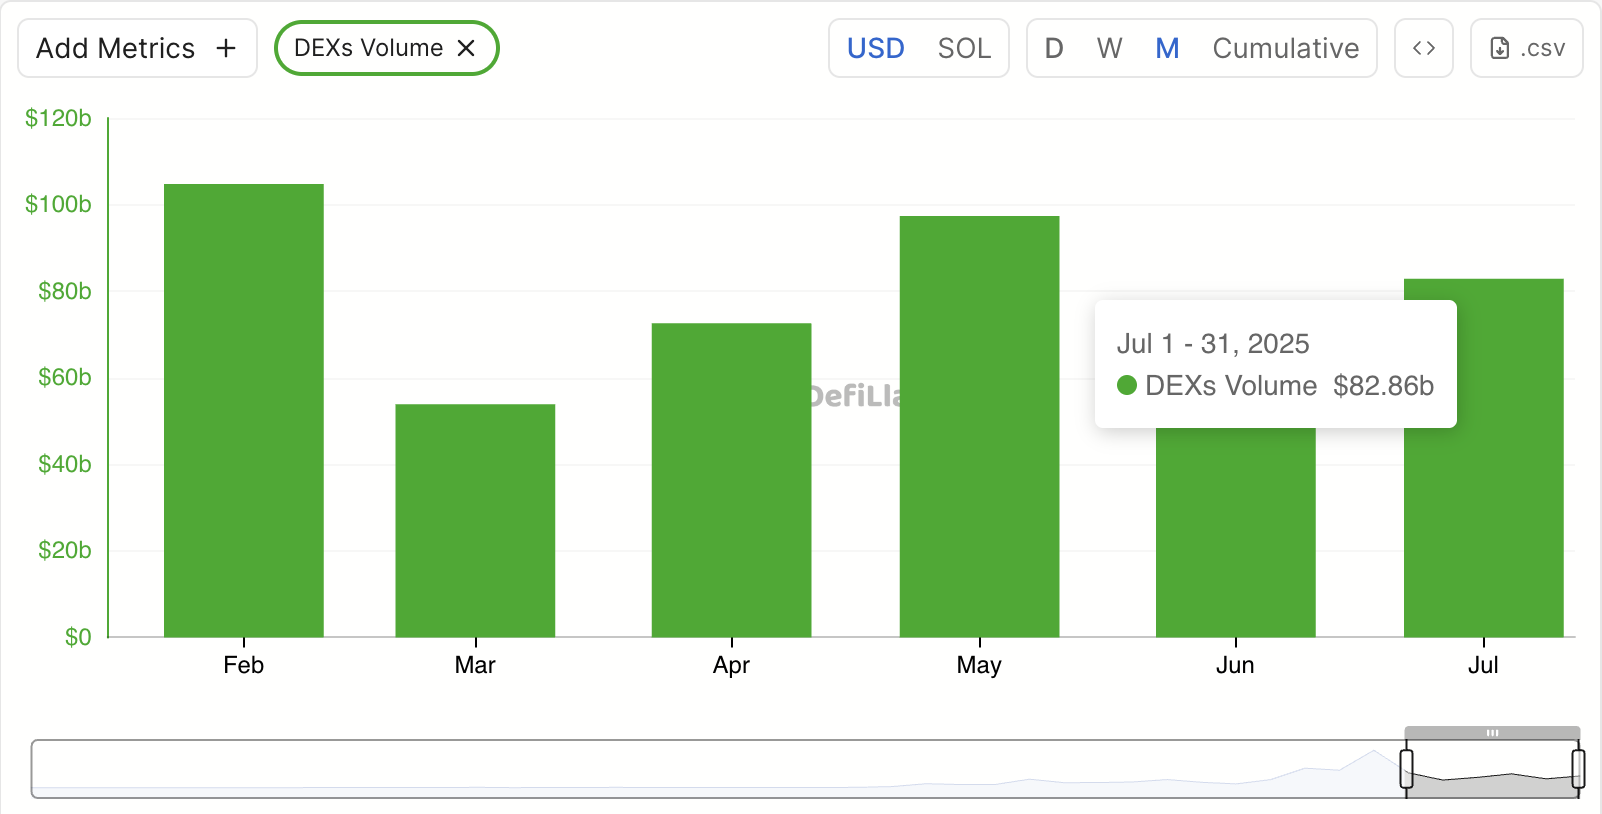
During that period, DEX trading activity also increased as demand for SOL grew. DEX Volume increased by 30% over the past 30 days, with over $82 billion in trading volume recorded this month.
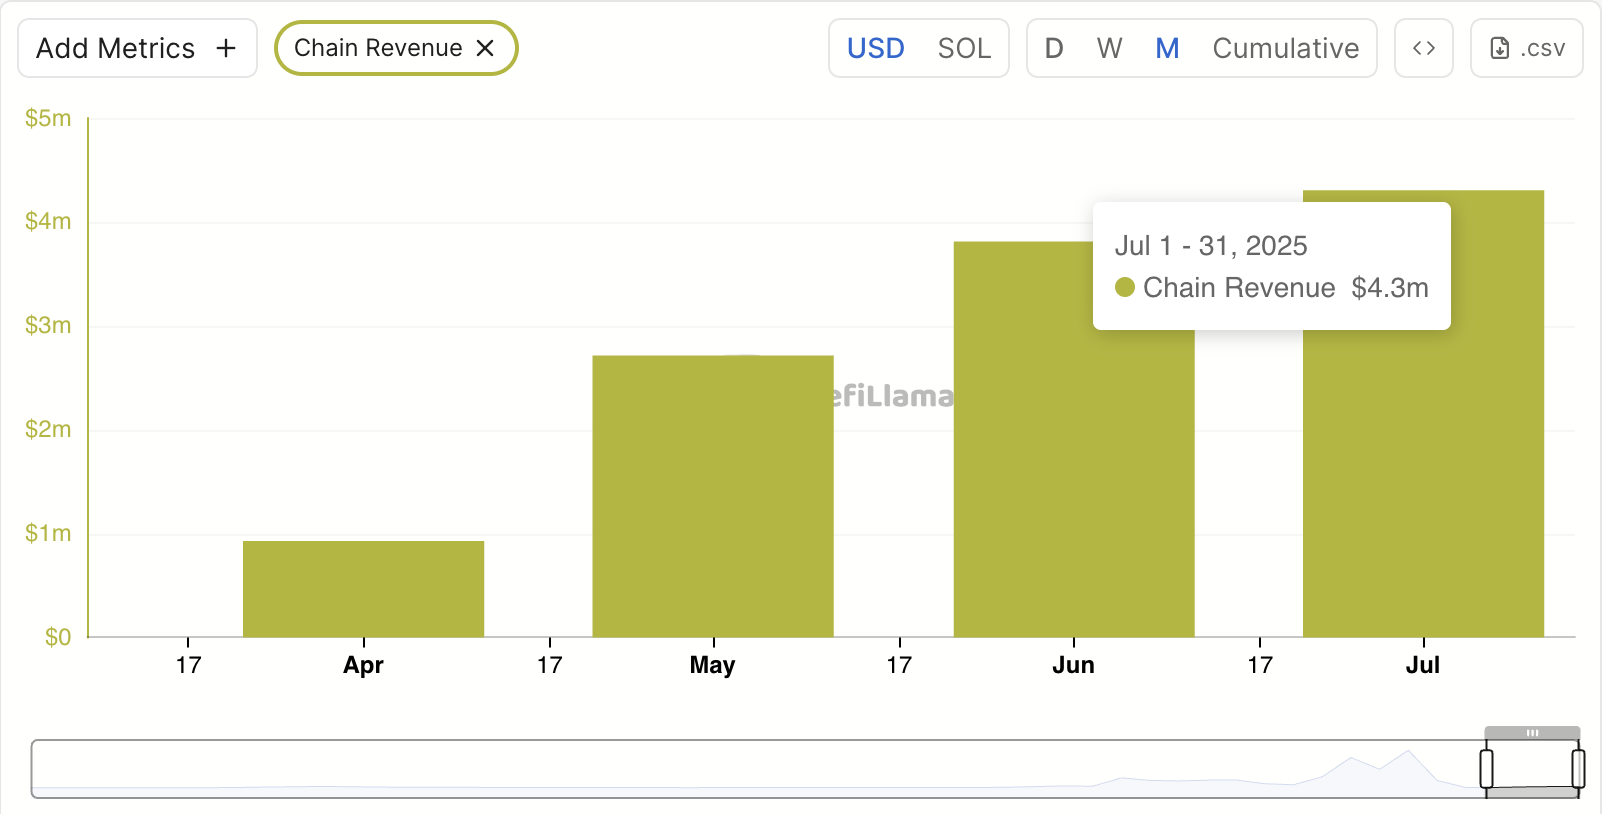
This surge in activity led to increased network revenue. According to defillama, Solana generated $4.3 million in revenue from early July, a 13% increase from June's $3.81 million.
Solana Ecosystem Cooling…Price Decline and Reduced User Activity
However, as August approaches, Solana network's momentum is weakening. At the time of reporting, SOL has dropped to around $180, with signs of demand weakening across the network.
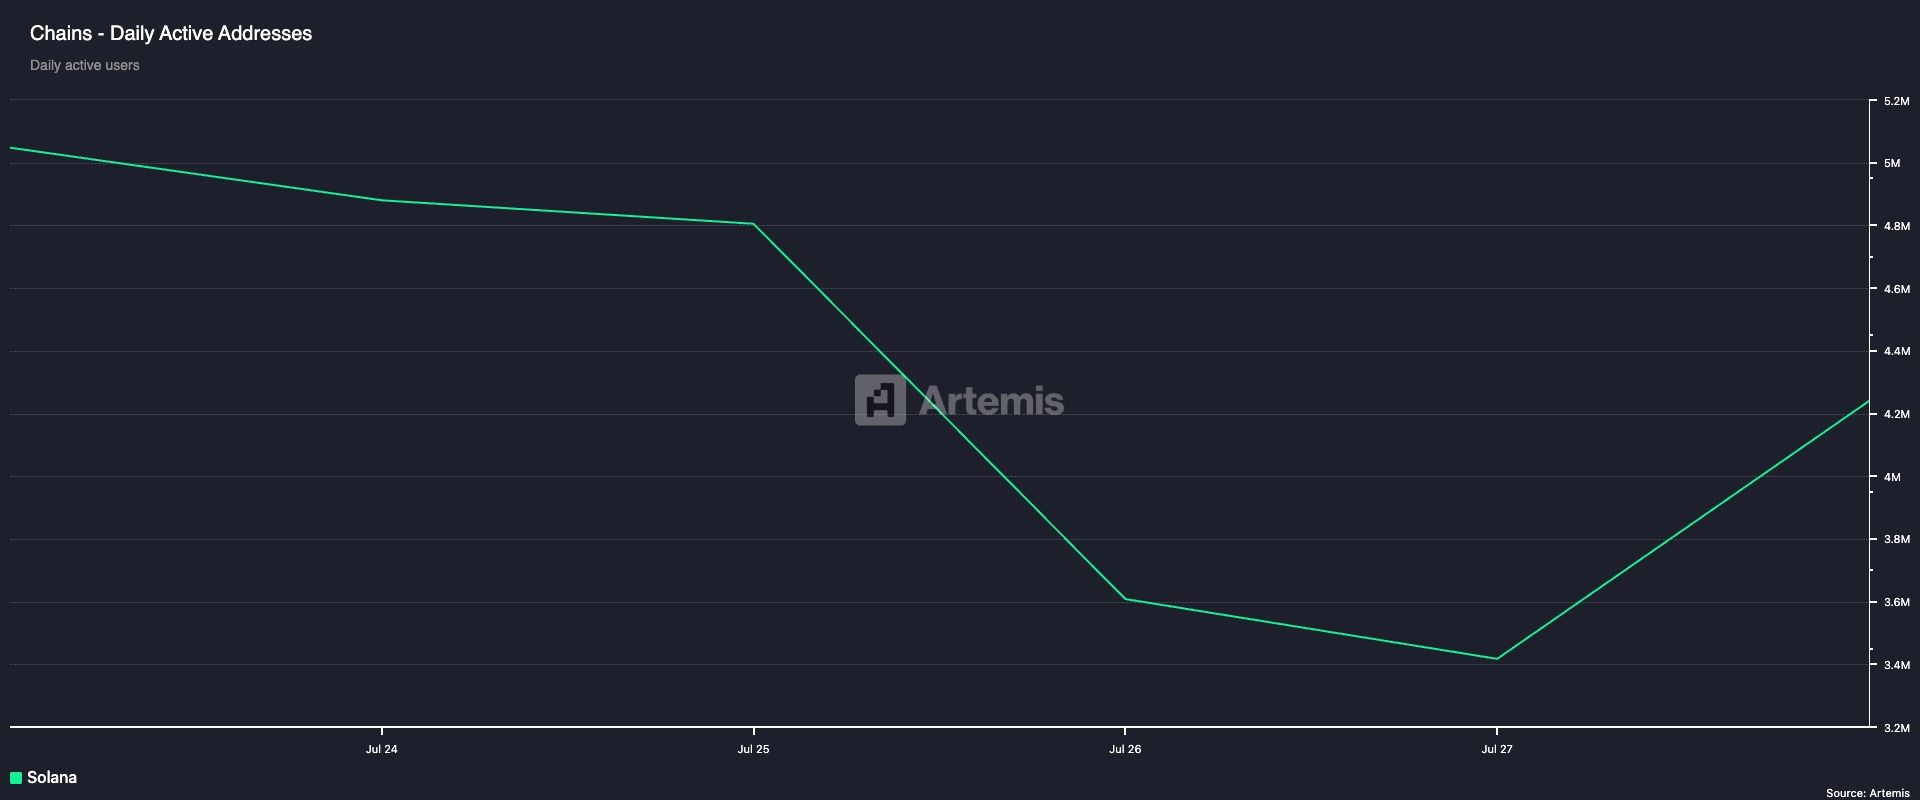
For instance, Solana's daily active addresses have sharply declined over the past 7 days, decreasing by 16% according to Artemis.
The decrease in network daily active addresses indicates reduced user engagement and on-chain activity. Fewer active addresses reflect decreased transactions, reduced dApp usage, and overall lower demand for network services.
In Solana's case, the 16% decline suggests reduced participation and implies an overall slowdown in network growth as a new trading month begins.
As network-wide activity decreases, Solana's DeFi TVL has also started to decline, dropping by 8% over the past week.
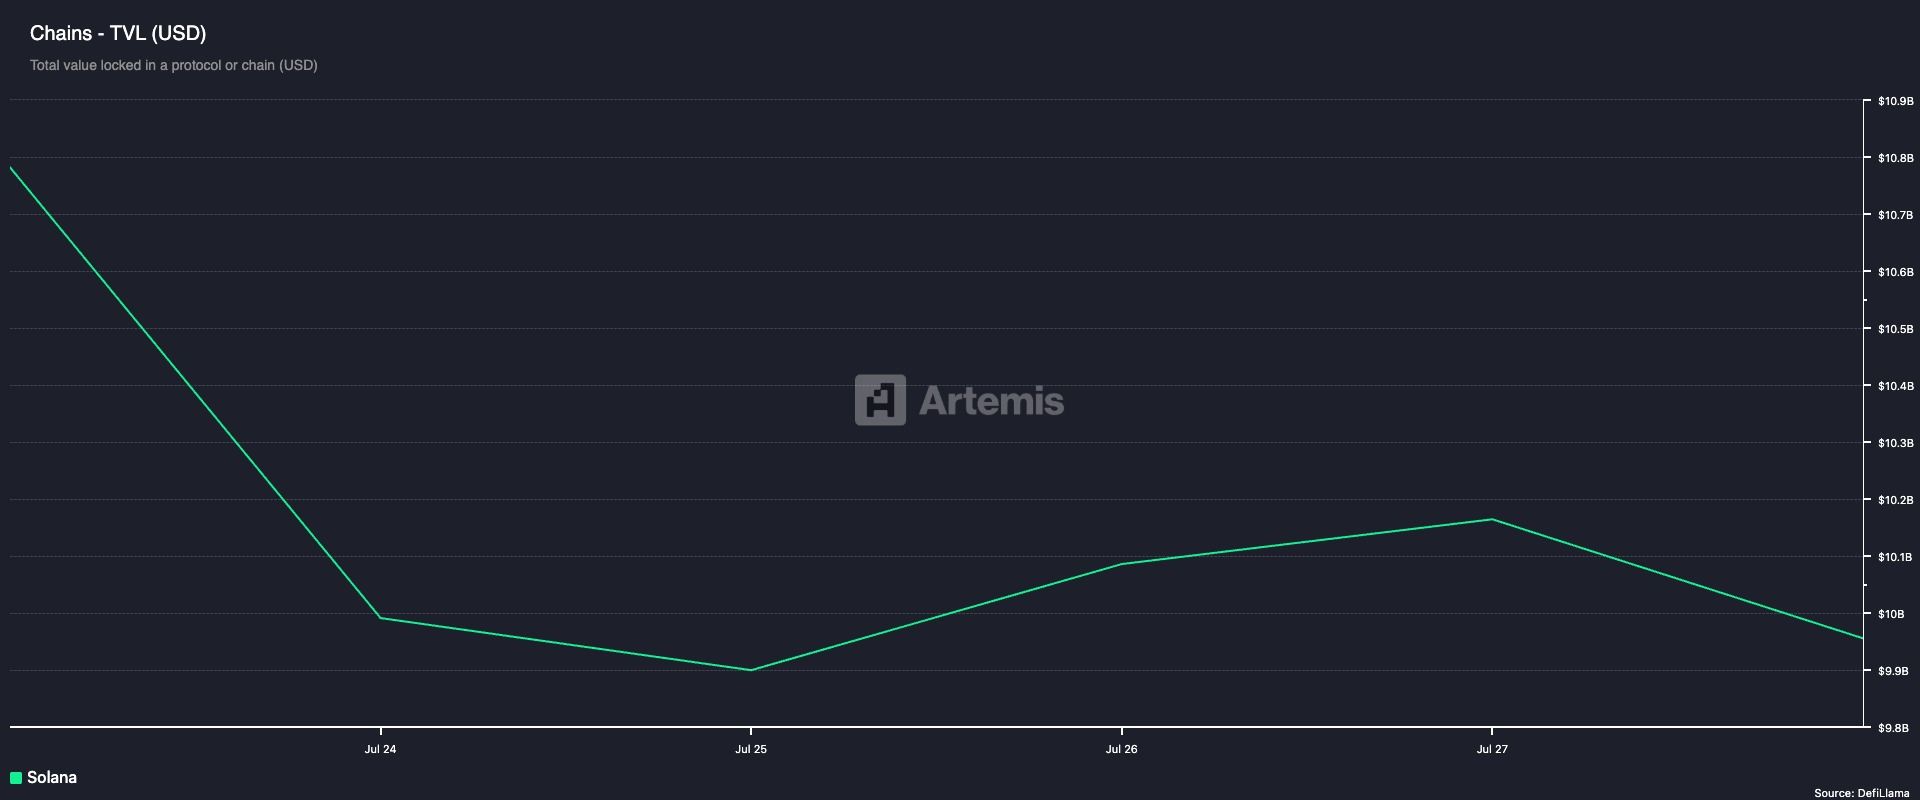
This indicates users are withdrawing assets from the network's DeFi protocols or asset values are declining due to market movements.
Solana, Price Decline Imminent…Bears Take Note
SOL's decline over the past few days has pushed its price dangerously close to the 20-day Exponential Moving Average (EMA), which serves as a critical dynamic support line at $178.25. For reference, SOL is currently trading at $180.51.
The 20-day EMA gives more weight to recent prices, measuring the average trading price of the asset over the past 20 trading days. A decisive drop below this level, accompanied by decreased trading volume and network activity, could open the door to further decline.
In this scenario, SOL's price could drop to $171.78.
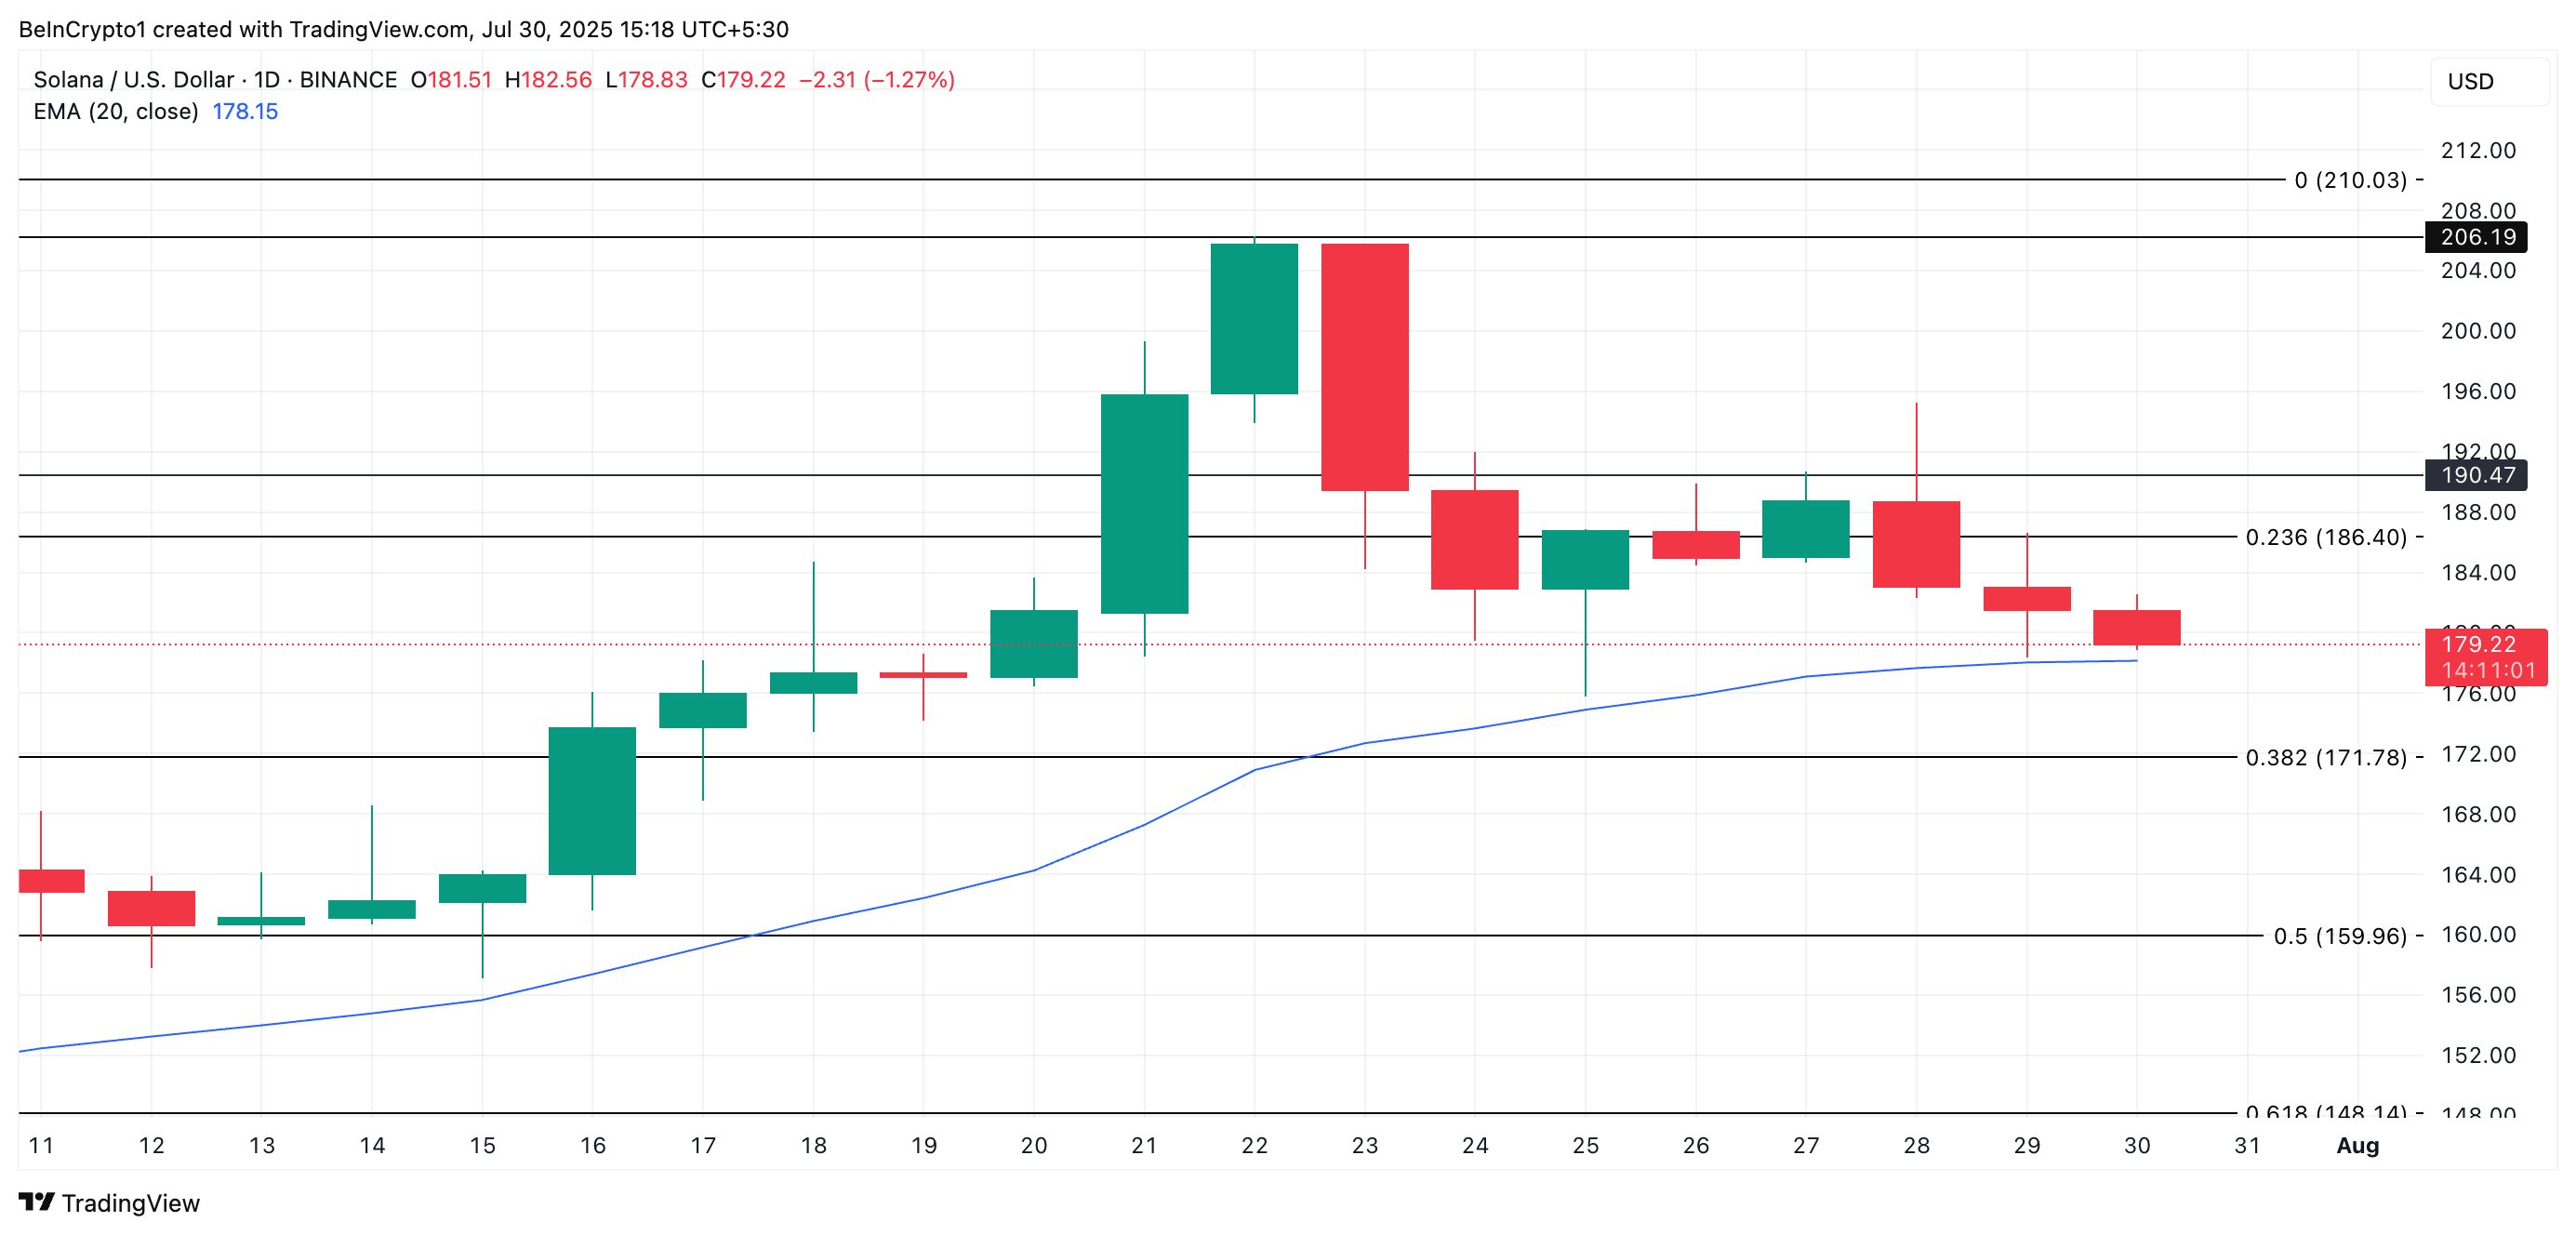
Meanwhile, this bearish outlook would be invalidated if market sentiment improves. In such a case, the coin's price could rise to $186.40. Successfully breaking this level could see the coin move towards $190.47.

