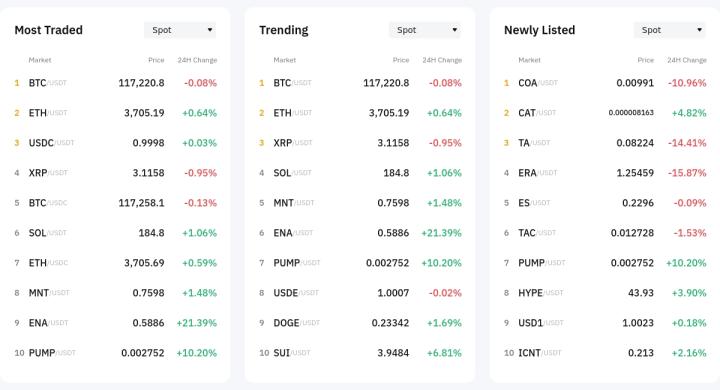
While the broader cryptocurrency market is retreating, Etena (ENA) is going against the trend, rising nearly 20% in the past 24 hours and catching everyone's attention.
However, what is truly noteworthy is the convergence of key signals such as increased whale activity, steady exchange outflows, and bullish chart setup. All indications suggest that something bigger might be happening. Is ENA preparing for a breakout rally?
Whales Accumulating Etena
The most important trend right now is that whales are buying and not selling. According to Nansen's dashboard, ENA whale holdings have increased by 8.15% over the past 7 days. At current prices, this is close to approximately $1.87 million.
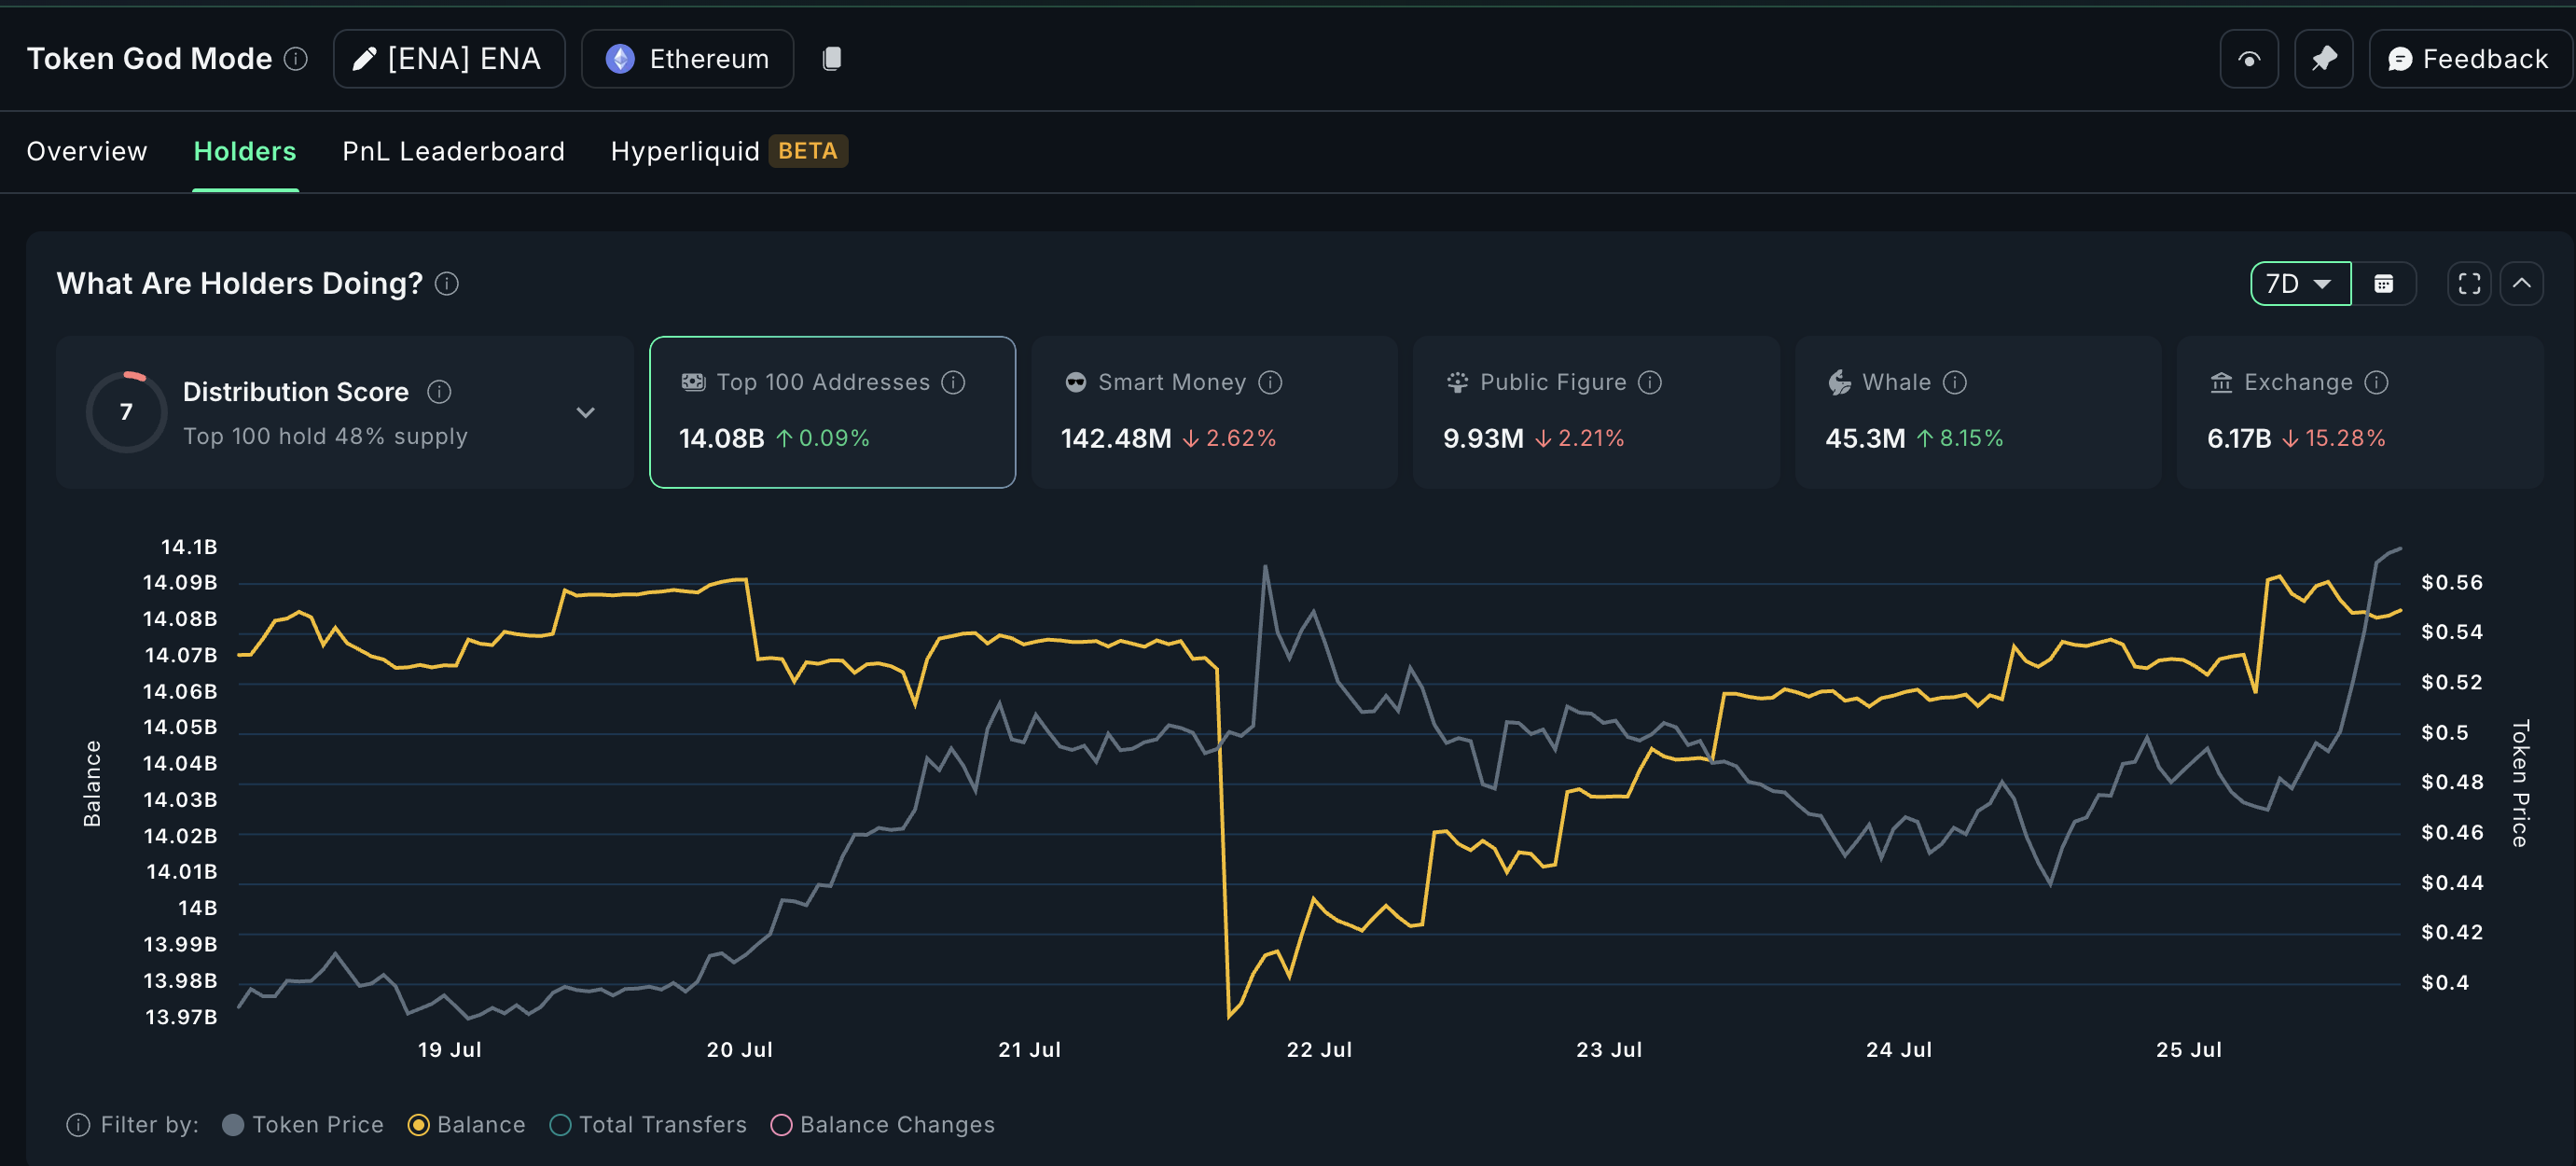
This is a sharp increase, occurring while most markets are stagnant or declining. Such whale behavior typically indicates confidence. Big players are preparing for a larger move.
Simultaneously, exchange balances are decreasing. Over the past week, 1.07 billion ENA tokens have been withdrawn from exchanges.
This means Etena (ENA) is moving from trading platforms to personal wallets. When this happens, it often indicates that holders plan to maintain their assets. Reduced supply on exchanges decreases the likelihood of sudden sell-offs.
In summary, large wallets are buying ENA, and the token is quietly disappearing from exchanges. This is a strong bullish setup.
OBV Divergence Hints at Momentum
The chart shows something even more interesting. While ENA's price recorded lower highs, the On-Balance Volume (OBV) recorded higher highs. This is called a bullish divergence, which occurs when volume flow is stronger than price movement by buyers.
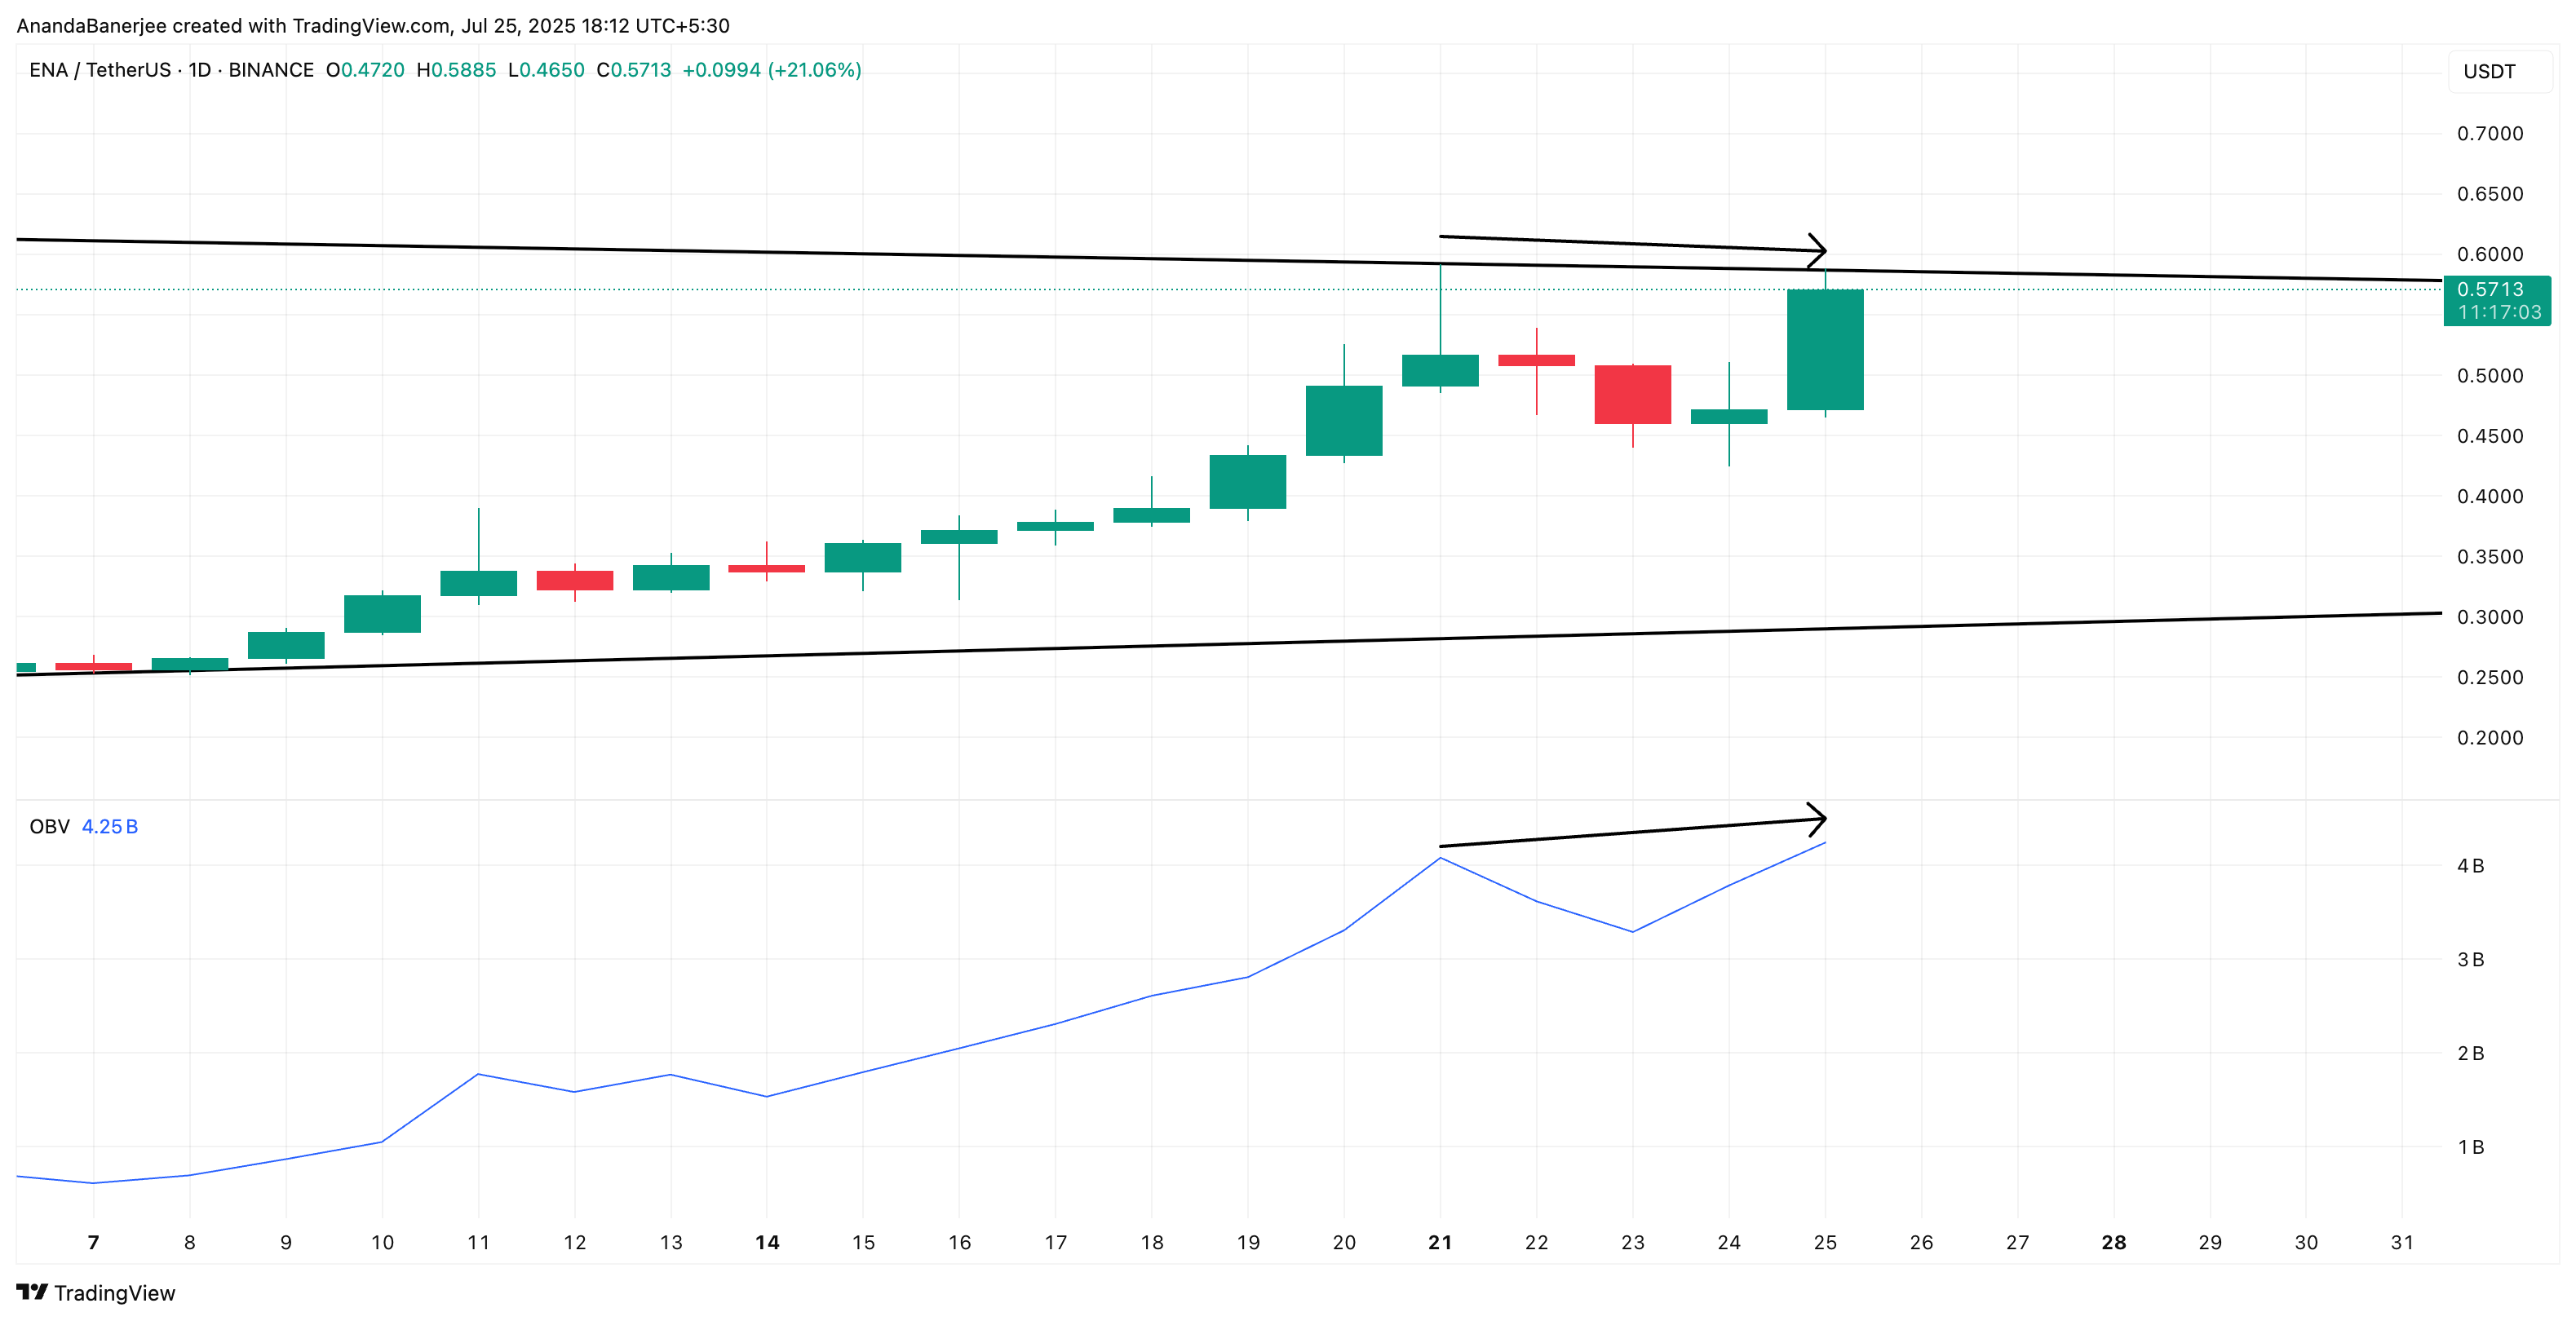
At the time of writing, ENA is still within a converging wedge pattern, trading near $0.57. The OBV trend is rising, suggesting buying pressure is forming beneath the surface. Buyers are quietly intervening while the price adjusts.
Such divergences often appear before a breakout. Combined with whale activity, it suggests accumulation might already be underway.
On-Balance Volume (OBV) helps discover hidden trends by tracking whether volume is flowing into or out of the token.
Token TA and Market Update: Want more such token insights? Subscribe to editor Harsh Notariya's daily crypto newsletter here.
Wedge Breakout... $0.60 Crucial for Continued Rise
Technically, ENA has been trading within a wedge since the end of June. However, the chart uses trend-based Fibonacci extension tools for additional verification. This tool is used to chart price targets during an uptrend.
The first point of the Fibonacci extension floating starts near $0.22 and extends to the recent swing high of $0.59. Yesterday, ENA retraced to $0.42, but today it strongly rebounded, remaining just below the breakout zone.
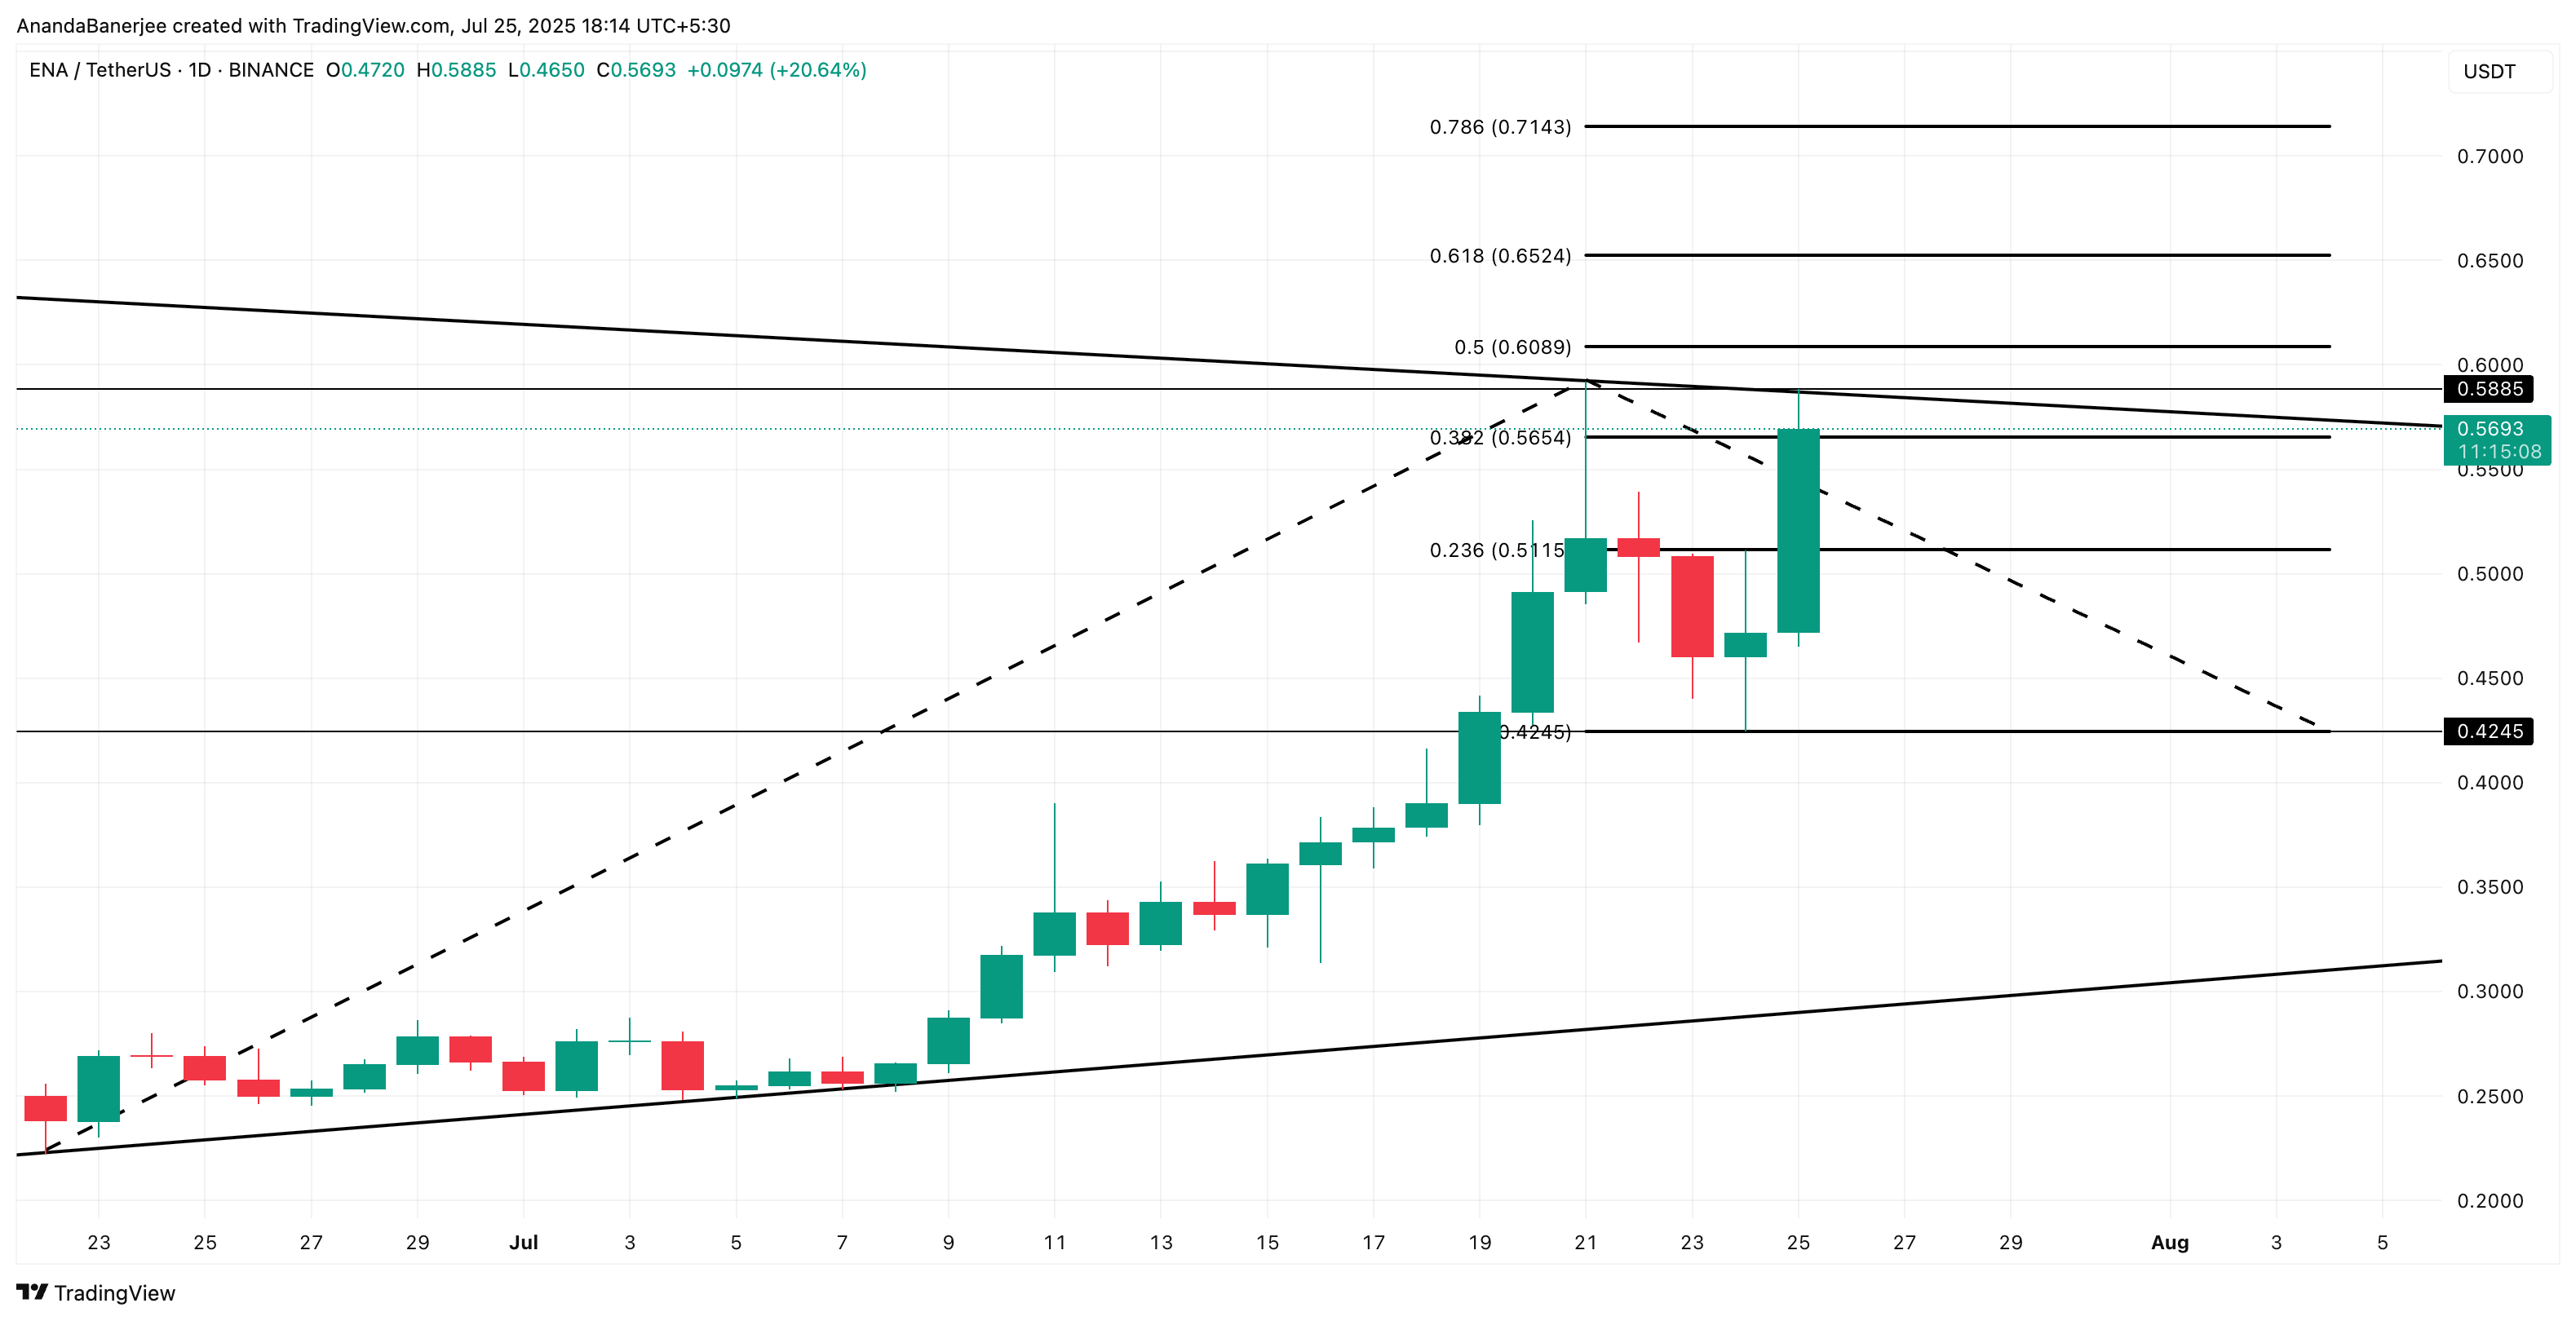
The big number to watch now is $0.60. This is the 0.5 Fibonacci extension level of the recent trend. Breaking cleanly through $0.58 and surpassing $0.60 could open a rally to $0.65, $0.71, or beyond, especially with current whale and volume support.
However, there's a catch. If ENA fails to break through and falls below $0.51, the bullish case weakens. This could invalidate the wedge breakout thesis and trigger a pullback.