Solana was trading near $203 at the time of writing, recovering slightly after falling below $200 earlier in the day. This small recovery kept daily losses at around 1%, but the overall structure remains weak.
Investors have reclaimed the $200 mark, but on- chain charts show that this momentum may not last long.
Long term investors are making great profits
The first warning sign comes from the Net Unrealized Profit/Loss (NUPL) of long-term investors. This metric tracks whether investors are making profits or losses on paper. When NUPL is high, it suggests that investors may be tempted to take profits.
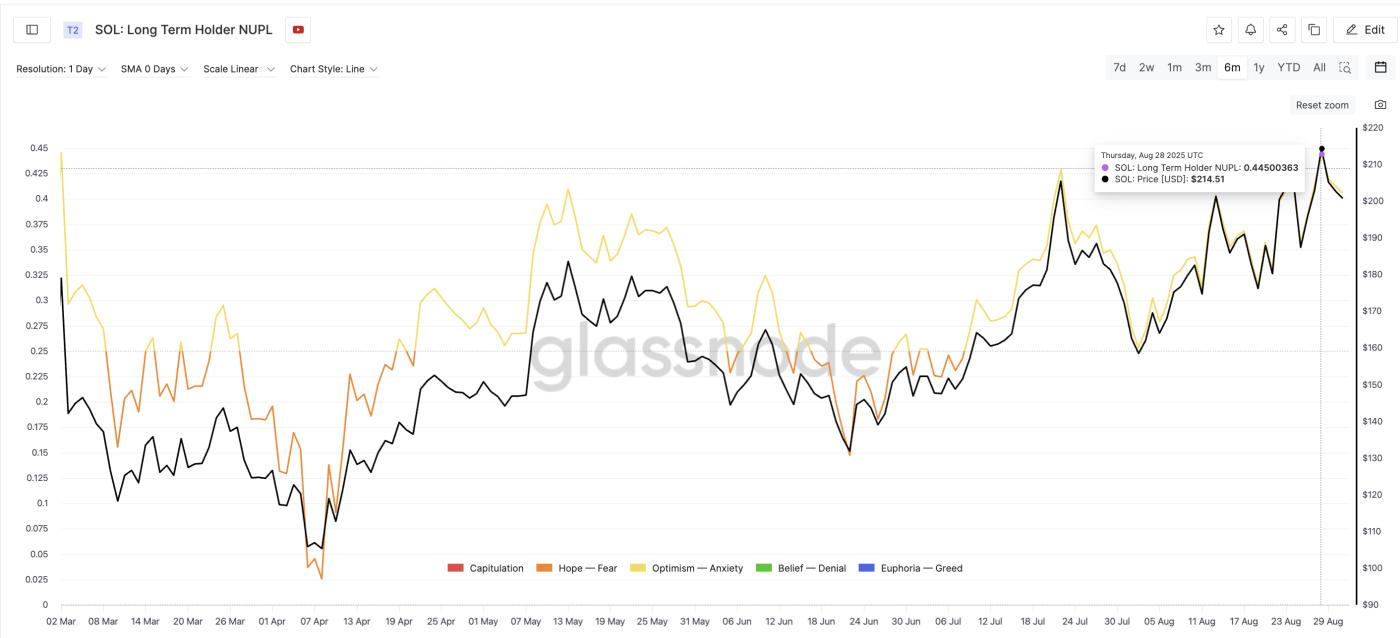 Solana at Risk of Profit Taking: Glassnode
On August 28, Solana long-term investors’ NUPL hit 0.44, a six-month high and close to the March 2 peak of 0.4457. The previous spike was followed by a sharp decline as Solana price fell from $179 to $105 in less than two weeks, a 41% correction. A more recent example was on July 22, when a 23% drop followed a NUPL peak.
The latest NUPL index has dipped slightly to 0.40, but remains high compared to recent months.
To stay updated on TA and the Token market: Want more Token insights like this? Sign up for Editor Harsh Notariya's daily Crypto Newsletter here .
Coin Days Destroyed Confirms Profit Taking
This concern is also reflected in the Coin Days Destroyed (CDD) metric, which tracks the number of old coins moving on chain, which could suggest profit-taking. Every time CDD spiked in the past six months, Solana price corrected sharply shortly after.
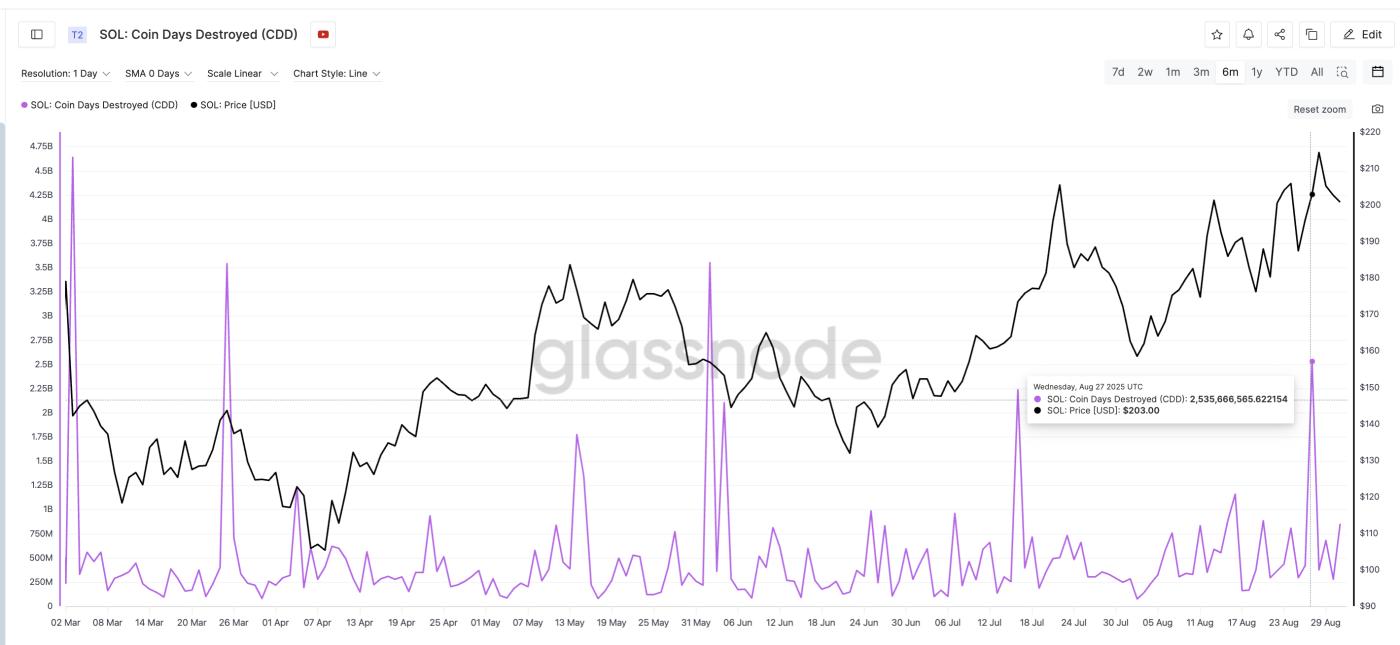 Old SOL Coins Are Moving: Glassnode
For example, on March 3, Solana price fell from $142 to $118, a 17% drop. Another spike on March 25 took the price from $143 to $105. Even when the move is delayed, as it was after July 16, the correction from $205 to $158 shows how strong the signal is.
The latest spike occurred on August 27, when Solana traded near $203. While the correction has only just begun, this pattern suggests that long-term investors may have already started selling, confirming what the NUPL data has suggested.
Important Solana Price Levels Confirm Risk
The technical chart completes the picture. Solana is trading near $203, turning resistance at $201 into temporary support. But the bullish case will only hold if there is a daily close above that level.
A drop below $196 or $191 would tilt the momentum to the downside, and a break of $175 would confirm a deeper correction.
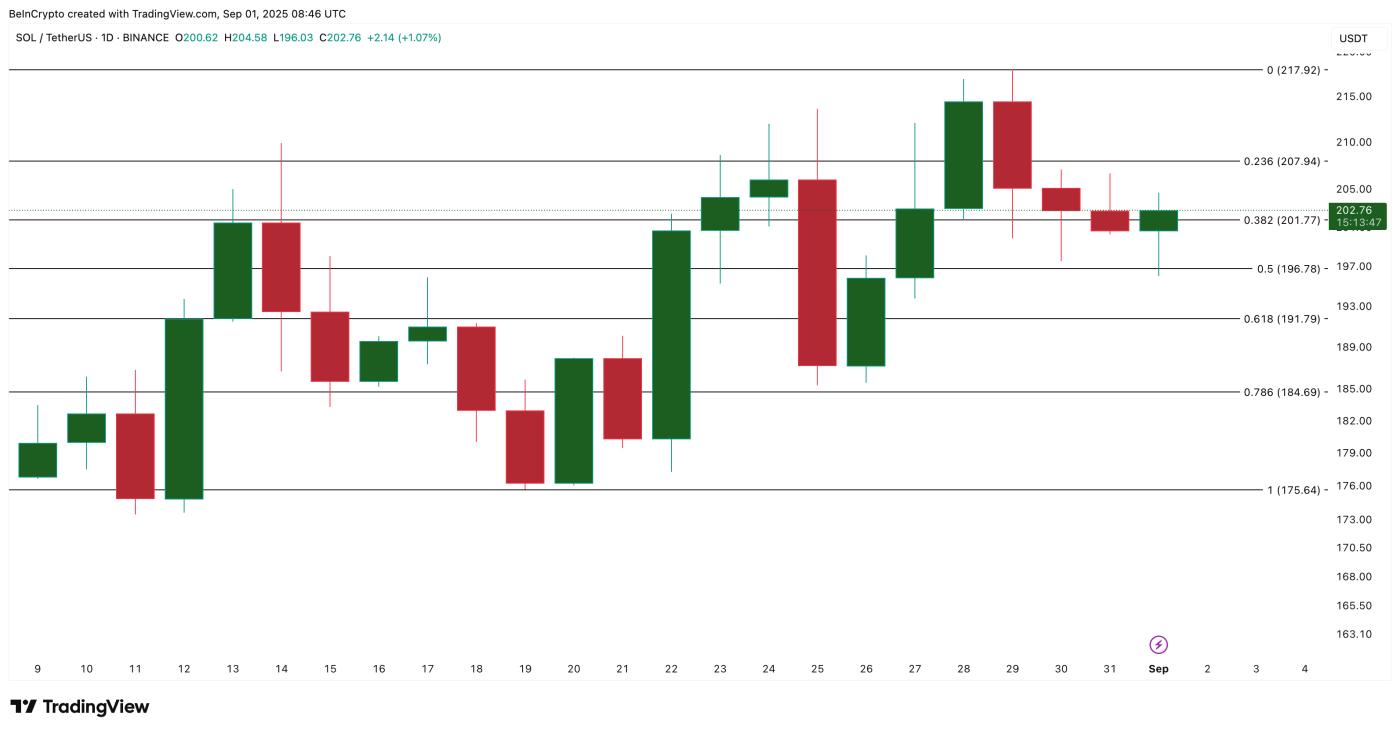 Solana Price Analysis : TradingView
On the upside, investors need to quickly regain higher positions, but with long-term investors taking profits and CDD showing the coin is moving, the risk of further decline remains.
However, the bearish trend would be lost if Solana price can clearly reclaim $207, with a full candle forming above that level. Currently, indicators suggest that Solana price recovery above $200 may not hold without stronger support.