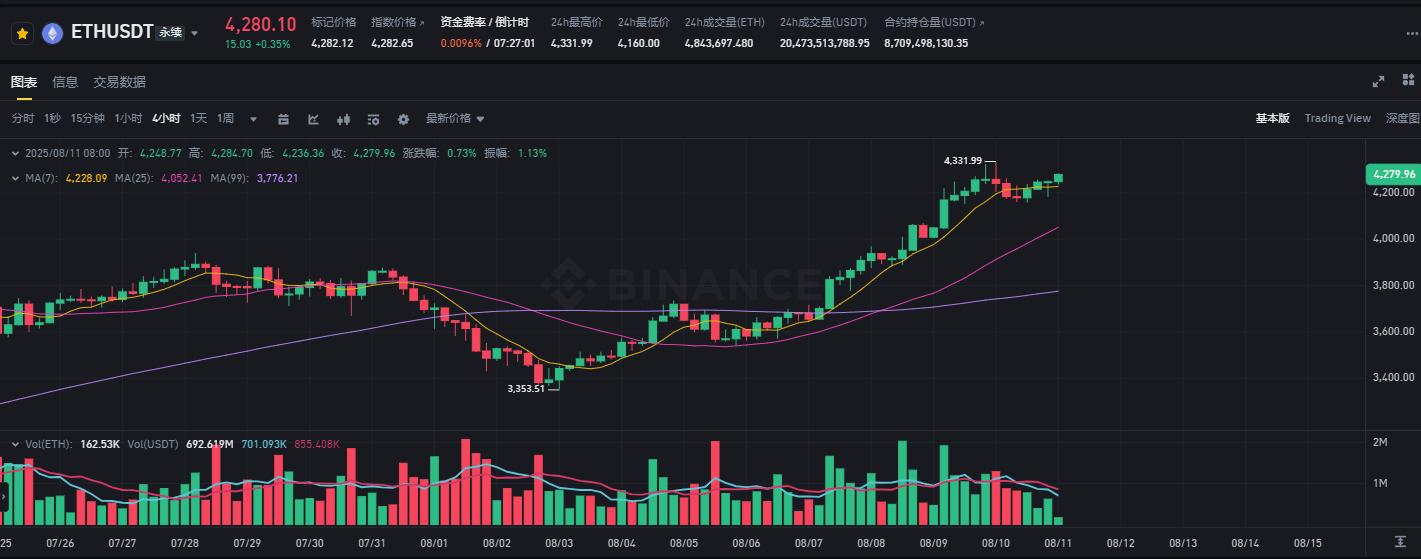
Ethereum broke through the psychological barrier of $4,000 with thunderous momentum in August 2025, reaching a high of $4,330 and creating a new high since 2022.
This breakthrough not only liquidated over $500 million in short positions but also ignited market expectations for the historical high ($4,877) and even five-digit prices. With technical pattern confirmation, continuous institutional fund inflow, and fundamental changes on-chain, analysts generally believe that Ethereum is standing at the starting point of a new super cycle, with a target of $10,000-$20,000 in the next 6-8 months.
I. $4,000 Breakthrough: From Psychological Resistance to Value Reassessment
Ethereum's fourth attempt to break $4,000 was drastically different from the previous three. From early 2024 to mid-2025, Ethereum had three failed attempts: in February 2024 due to lack of fund follow-up, in May with spot ETF approval but low institutional interest due to non-staking functionality, and another failure after the brief Trump election euphoria. This breakthrough's deep driving force comes from three fundamental changes:
- Liquidity Structure Transformation: Spot ETH ETF has seen continuous 18-day net inflow since early July, accumulating over $5.3 billion, with a daily peak of $218 million, forming stable institutional buying support. Corporate balance sheet allocation demand simultaneously exploded, with companies like SharpLink Gaming accumulating 438,000 ETH (worth $1.69 billion), intensifying supply contraction.
- Technical Upgrade Removing Obstacles: The Petra upgrade completed in May 2025 increased large-scale staking deposit and withdrawal speed by dozens of times, paving the way for staking ETF. SEC subsequently clarified that "staking tokens are not securities", completely removing regulatory concerns.
- Macroeconomic Policy Shift: The US "Regulatory Clarity Act" passed, incorporating mature blockchain into legal definition; OCC allowed banks to provide crypto custody services, and the Federal Reserve simplified stablecoin issuance process, building a compliant infrastructure for on-chain finance.
At this moment, $4,000 is no longer just a price resistance level, but a value critical point of traditional finance and crypto ecosystem integration.
II. Technical Pattern Resonance: Three Frameworks Pointing to Five-Digit Target
2.1 Wyckoff Accumulation Pattern's Measurement Target
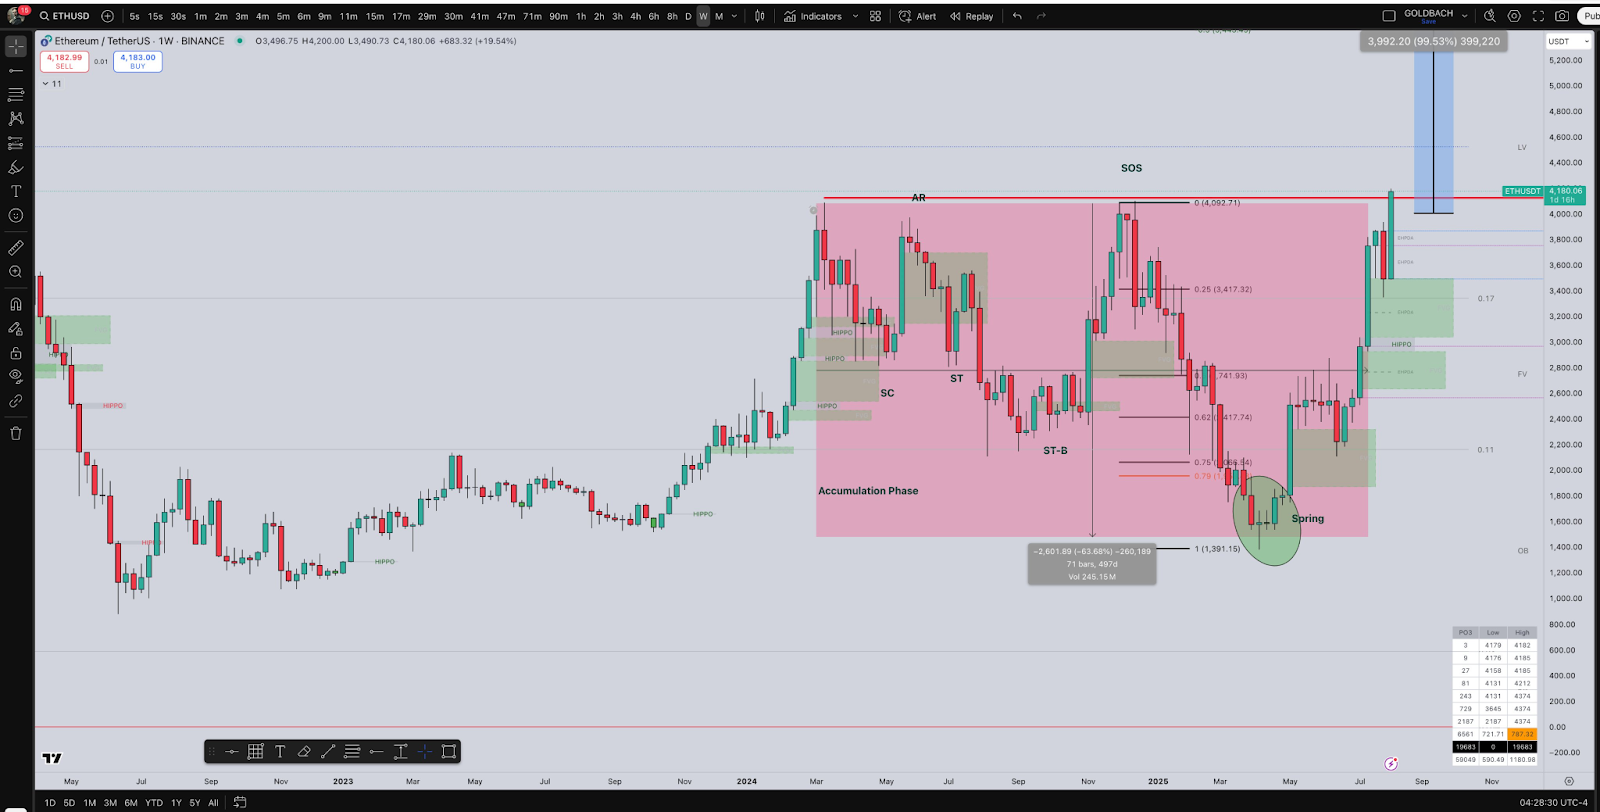 ETH/USD Weekly Price Chart.
Ethereum's weekly chart shows a classic Wyckoff accumulation structure: oscillating between $1,750-$4,081 from 2024-2025, forming a "Spring effect". Breaking $4,200 in early August confirmed the "Sign of Strength" (SOS), entering an accelerated upward phase.
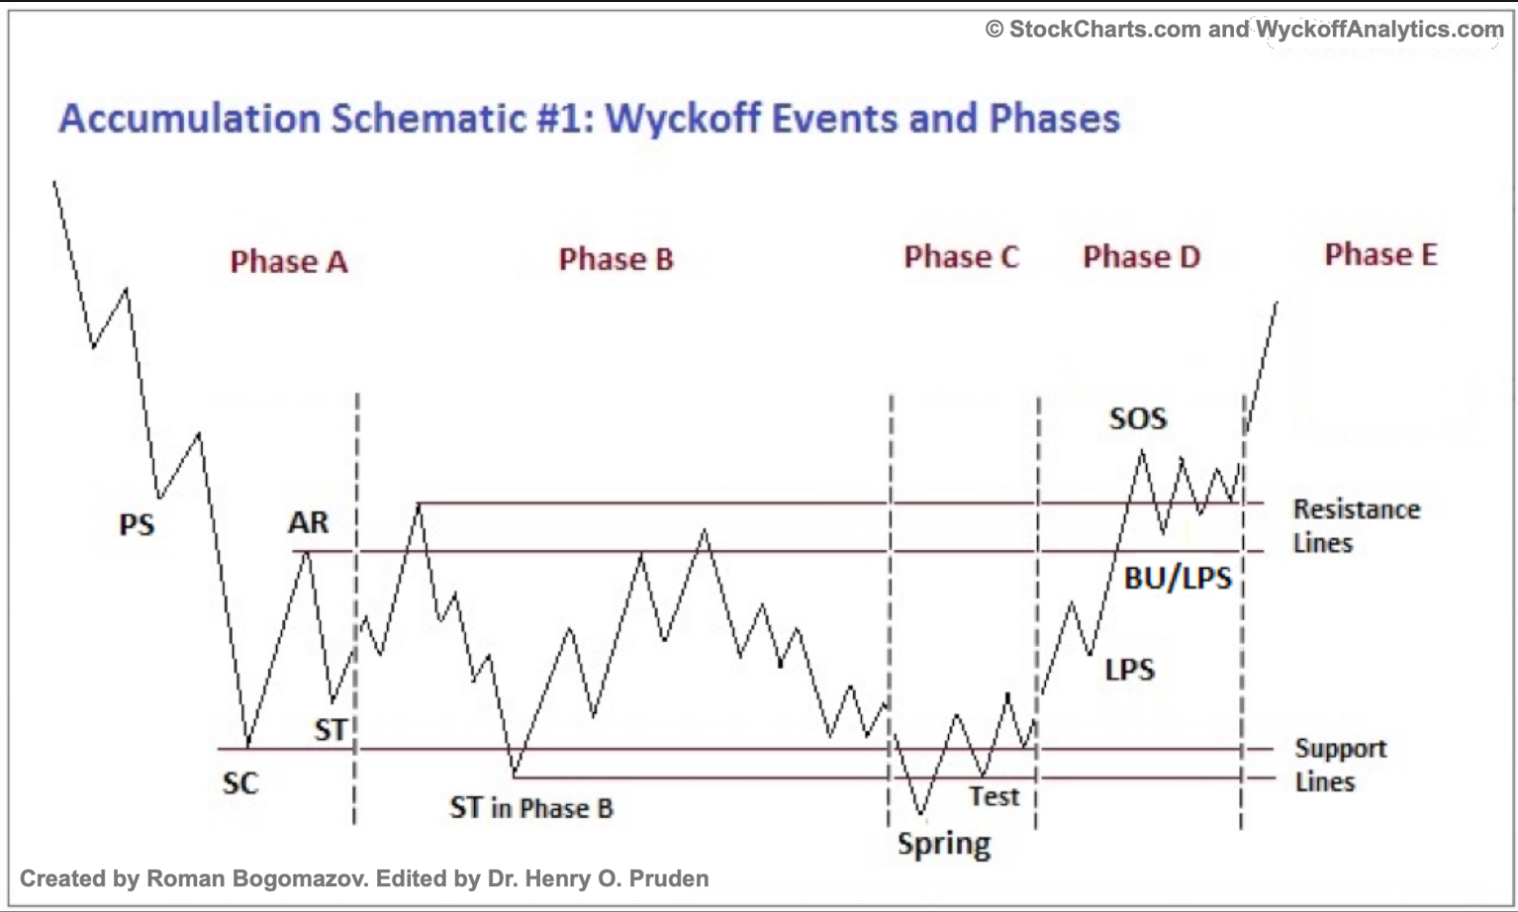 Wyckoff Accumulation Pattern Diagram. In Wyckoff's model, this is usually accompanied by a brief pullback, or "Last Point of Support" (LPS), to confirm the new upward trend.
According to Wyckoff theory, the minimum technical target after breakthrough is the accumulation range height ($4,081-$1,750=2,331) added to the breakout point, corresponding to $6,412. If a pullback forms an "Last Point of Support" (LPS) before volume-driven upward movement, the target will be revised to the $6,000-$6,500 range.
2.2 Triangle Breakthrough's Leverage Effect
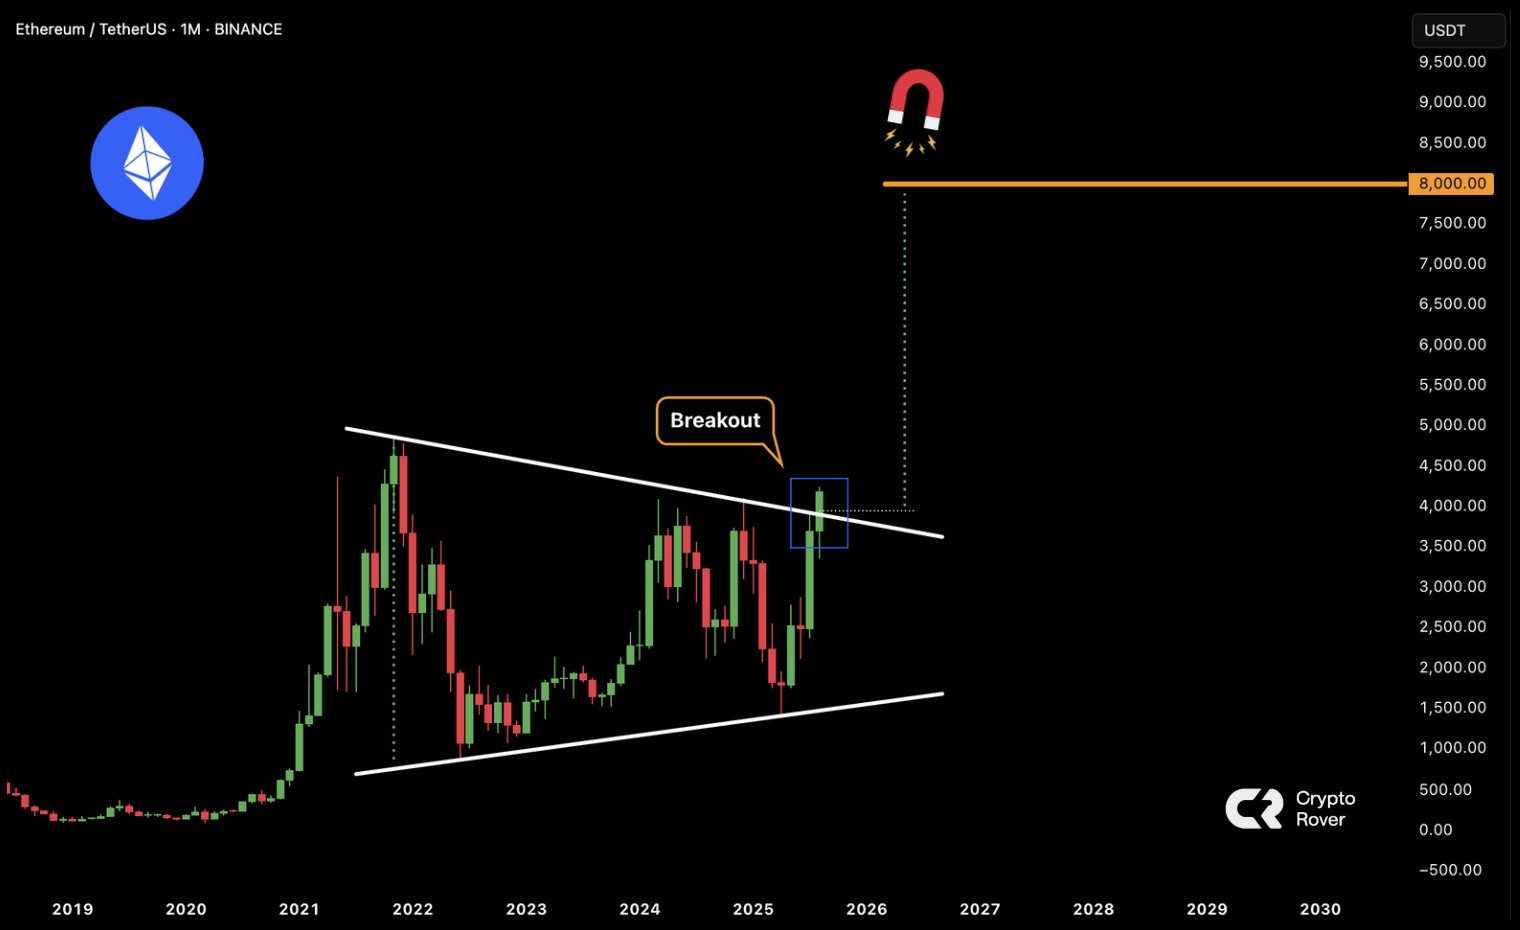
ETH/USDT Monthly Price Trend Chart
- Symmetrical Triangle: Ethereum's monthly chart forms a 42-month symmetrical triangle, with the upper line connecting the 2021 high point and 2024 high point. Breaking $4,200 neckline, the theoretical target is the triangle's maximum height ($4,950-880=4,070) added to the breakout point, pointing to $8,070.
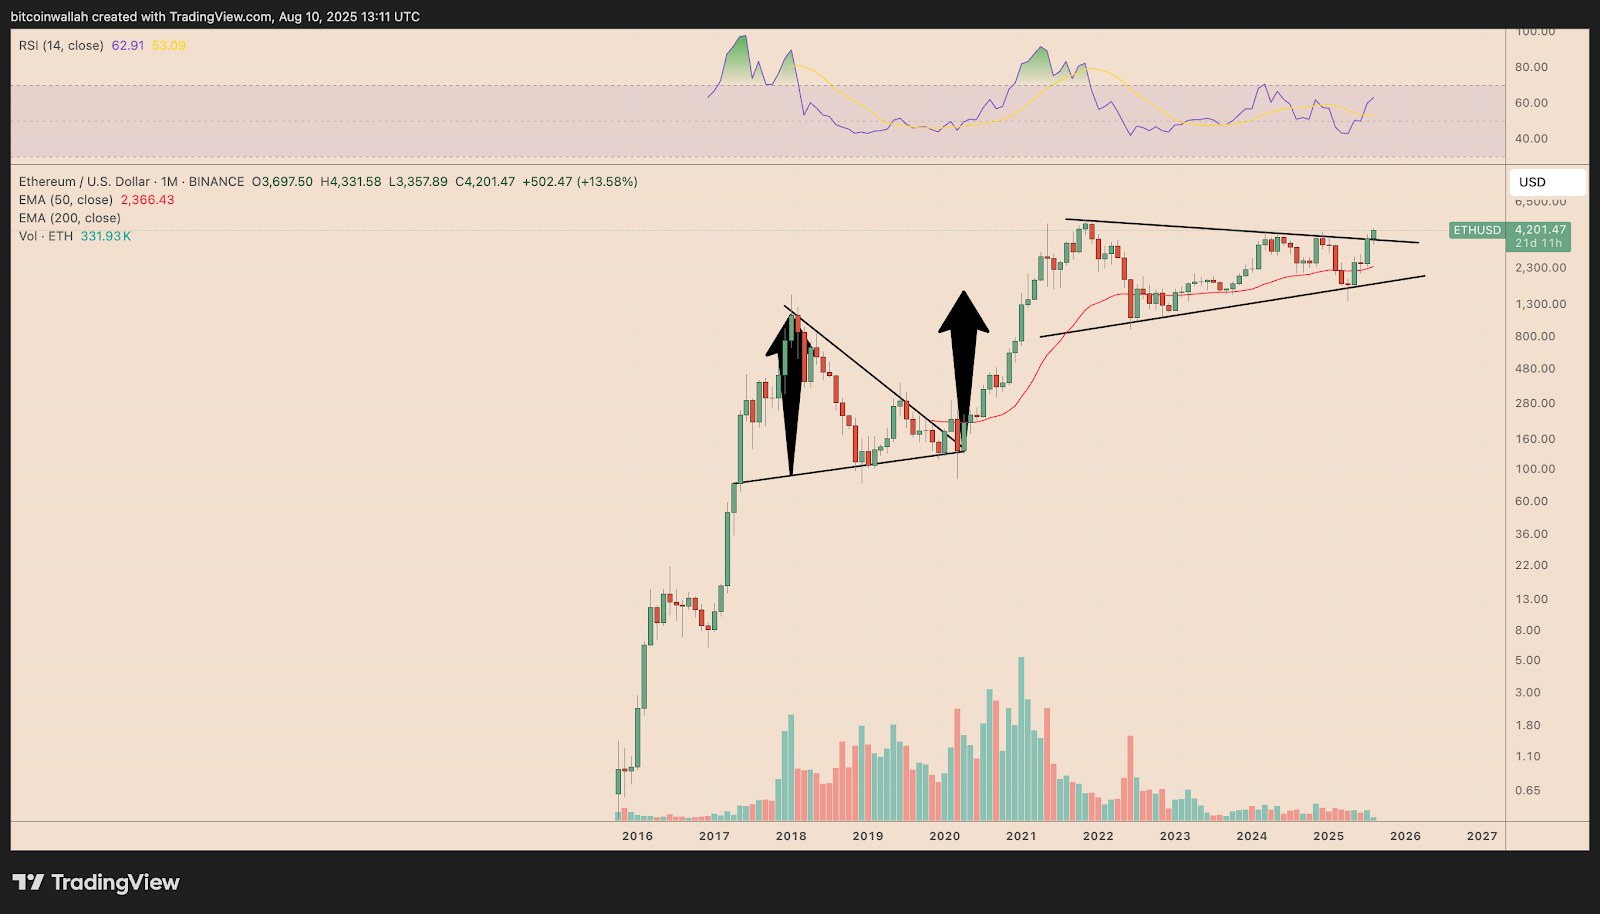 ETH/USD Monthly Price Chart.
- Ascending Triangle: Mikycrypto Bull points out a more grand ascending triangle structure, with a target directly at $16,700 after breaking $4,000. Historical fractal strengthens this expectation - similar breakthrough in April 2020 saw Ethereum rise 950% and exceed the target.
2.3 Historical Fractal's Spacetime Mapping
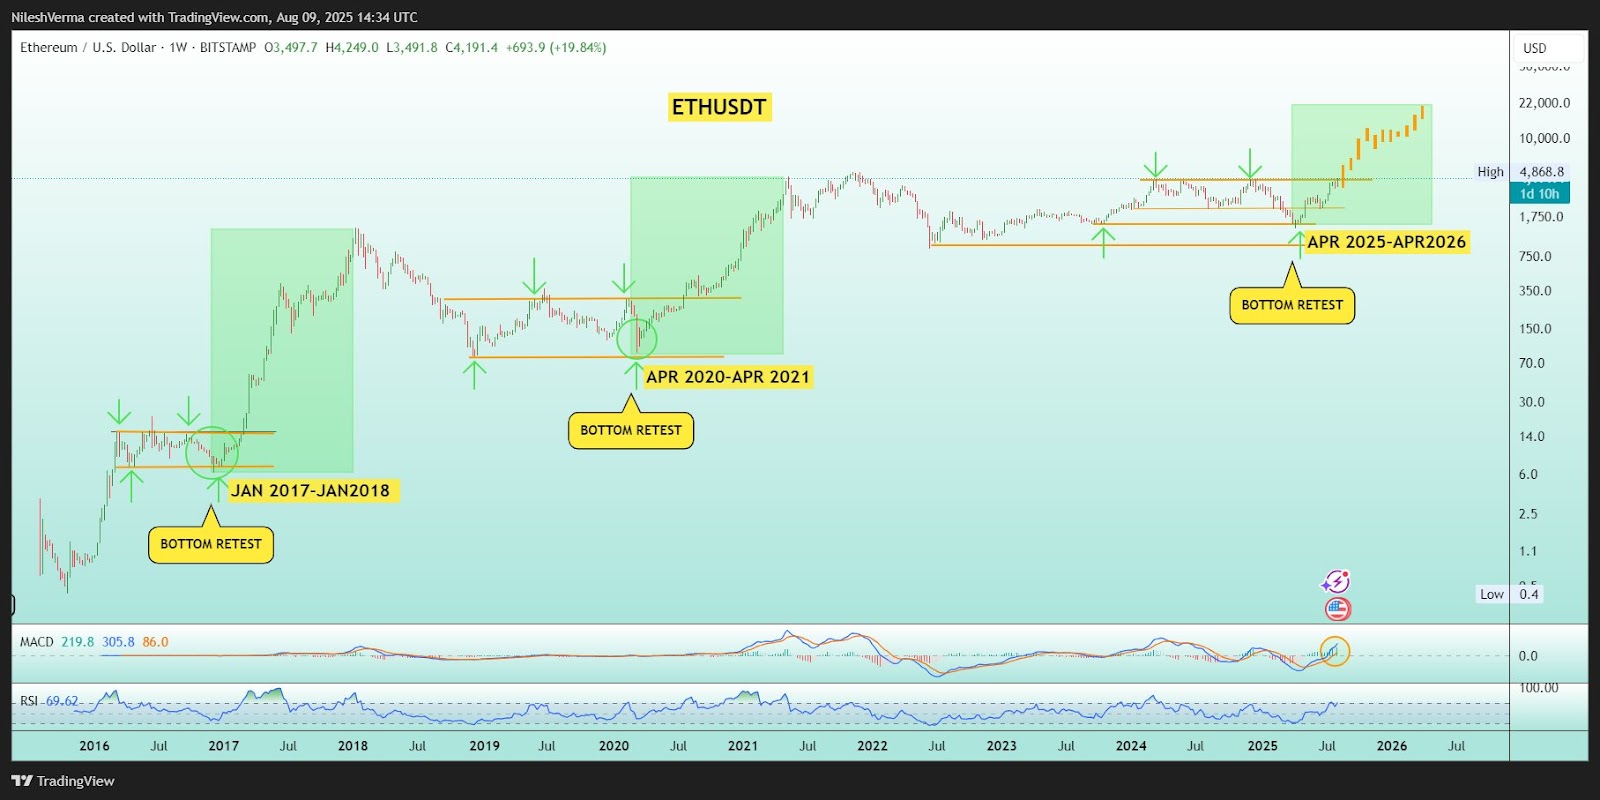 ETH/USD Weekly Price Chart
Nilesh Verma discovered Ethereum is reliving key fractals from January 2017 and April 2020: opening a parabolic rise after retesting the main bottom (April 2025 $1,750 area). Previous rebounds reached 8,000% and 950%, lasting about 12 months. If the fractal continues, this round of rise will last until April 2026, with a conservative target of $10,000 and an optimistic view of $20,000.
Merlijn The Trader additionally noted that the monthly MACD golden cross further confirms the upward trend - after this signal in 2020, ETH rose 2,000%, and in Q4 2023, it rose 130%.
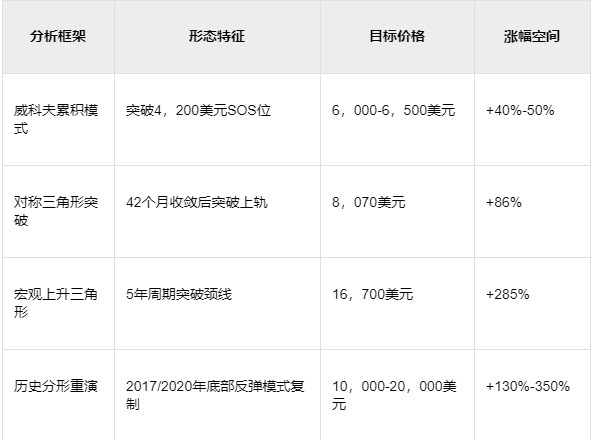
Table: Ethereum Technical Pattern Price Target Calculation
III. Value Support Reconstruction: From Deflationary Mechanism to On-Chain Finance
3.1 Self-Reinforcing Deflationary Mechanism
- Accelerated Burning: Since EIP-1559 implementation, 5.3 million ETH have been permanently burned, worth over $21 billion. During network activity, daily ETH burn can reach 12,000, with an annual deflation rate exceeding 1.5%.
- Staking Lockup: Beacon chain staked ETH accounts for 30% (about 36 million), and although Petra upgrade enhances liquidity, validators' average unlock period remains 3-6 months.
- Issuance Reduction: After PoS merger, new annual ETH issuance dropped to 800,000, only 10% of the PoW era. Bitwise calculates that institutional annual demand ($20 billion) is 8 times new supply, and supply-demand imbalance will continue to drive price up.
3.2 Staking ETF Igniting Institutional Allocation
BlackRock's staking ETF application on July 14 marks the entry of Ethereum into a new "on-chain finance" era. Unlike early spot ETFs, staking ETF allows institutions to capture both ETH price appreciation and staking returns (4%-6% annually). Referencing Grayscale Bitcoin Trust's effect of driving BTC up over 300%, staking ETF might attract conservative capital like pension funds, replicating the 401k Bitcoin allocation path.
3.3 Ecological Expansion Forming Value Capture Network
- Layer2 Explosion: Arbitrum, Optimism, and other L2 solutions have increased mainnet TPS to over 100,000, reduced transaction costs to $0.01, and driven DeFi TVL back to $18 billion, a 450% growth from the 2023 low.
- RWA Asset Tokenization: BlackRock and Fidelity have tokenized fund shares and US Treasury bonds, with on-chain RWA market value breaking through $60 billion. Goldman Sachs predicts the tokenized asset market will reach $16 trillion by 2030, with Ethereum capturing enormous value as the preferred settlement layer.
Conclusion: Path to a Trillion-Dollar Market Value
Ethereum breaking through $4,000 is the result of a triple resonance of technical patterns, institutional behavior, and on-chain fundamentals. The Wyckoff model and triangle breakthrough suggest a tactical target of $6,000-$16,700, while historical fractal mapping indicates a strategic space of $10,000-$20,000. The underlying support comes from the deflationary mechanism reshaping scarcity, billions in incremental funds from ETH staking ETF, and RWA's transformative catalyst for on-chain finance.
Although a short-term pullback is possible (such as testing the $3,800 support level), the monthly MACD golden cross and continuous institutional net inflows suggest that the adjustment is an opportunity for positioning. When Ethereum's market value breaks through $1 trillion (corresponding to $8,400), it will surpass Visa and Maotai to become one of the top five global assets, truly establishing its ultimate status as the "decentralized world computer".