Bitcoin price may be holding above $117,500, but under the surface, signs of a potential pullback are mounting.
On-chain signals from long-term holders and whale activity are in sync with key price action levels, and if history is any guide, this confluence could trigger a healthy correction in the days ahead.
Long-Term Holder SOPR As The Silent Exit Signal
The Spent Output Profit Ratio (SOPR) for long-term holders, those holding BTC for more than 155 days, is showing consistent signs of profit-taking. As of July 21, the Long-Term SOPR stood at 1.96, meaning these holders are selling their coins for nearly double their acquisition cost.
While that number alone may not sound alarming, context tells the story.
For token TA and market updates: Want more token insights like this? Sign up for Editor Harsh Notariya’s Daily Crypto Newsletter here.
 Bitcoin price and Long-Term SOPR: CryptoQuant
Zooming out on a 1-year chart, SOPR spikes have historically preceded sharp corrections. Consider this:
- February 9: SOPR hit 5.77, BTC dropped from $96,479 to $84,365: a 12.55% drop
- June 13: SOPR was 3.47, BTC dipped from $106,108 to $101,003: a 4.81% drop
Since July 9, SOPR has seen a series of elevated peaks:
- 3.90
- 3.25
- 3.50
Note: The biggest profit-taking day, per the chart, was July 4. The Long-Term SOPR shot past 24, but surprisingly, Bitcoin price didn’t correct significantly post that.
This delayed reaction builds tension and increases the odds of a catch-up correction soon.
Whale-to-Exchange Ratio Quietly Climbing Again
Another red flag comes from the Whale-to-Exchange Ratio, which tracks how much BTC whales (large holders) are sending to exchanges compared to overall market activity.
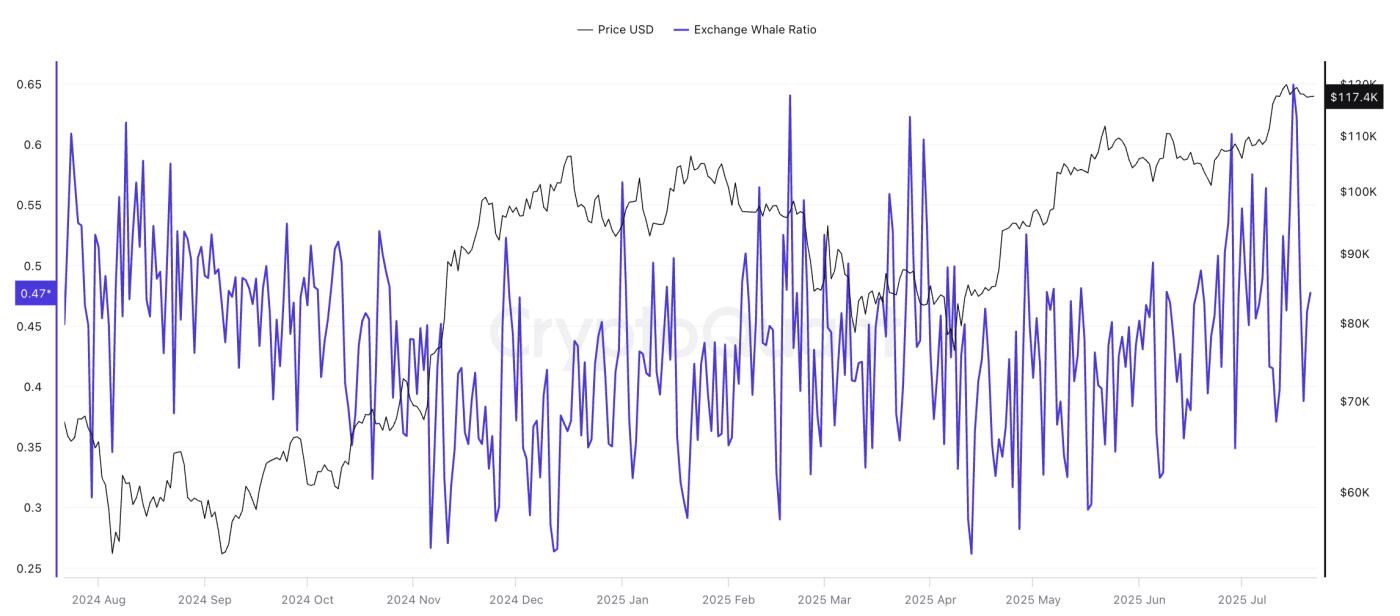 Bitcoin price and Exchange-Whale Ratio: CryptoQuant
Historically, whenever this ratio touches or exceeds the price trendline, a correction tends to follow. Two recent examples:
- June 28:
- W2E Ratio = 0.608
- BTC = $107,351
- A few days later, BTC dropped to $105,727
- July 16:
- W2E Ratio = 0.649
- BTC = $118,682
- Price has since stalled and shown signs of weakening
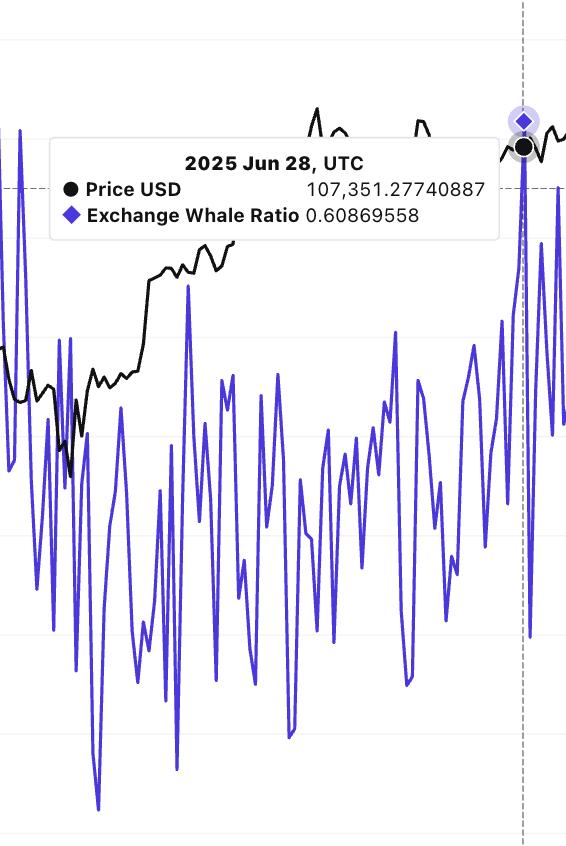 Exchange-Whale Ratio and Price Correlation: CryptoQuant
Put simply: When whales move more coins to exchanges, they’re usually getting ready to sell.
With the current W2E Ratio again peaking, it suggests distribution pressure is quietly building, even if spot markets seem calm.
Bitcoin Price Structure Relies On Key Support Levels
From a price structure standpoint, Bitcoin is currently trading around $117,500, showing signs of indecision. Since July 12, the price has repeatedly tested and respected the $116,456 level, which coincides with the 0.236 Fibonacci retracement of the recent impulse move from $98,230 to the $122,086 high.
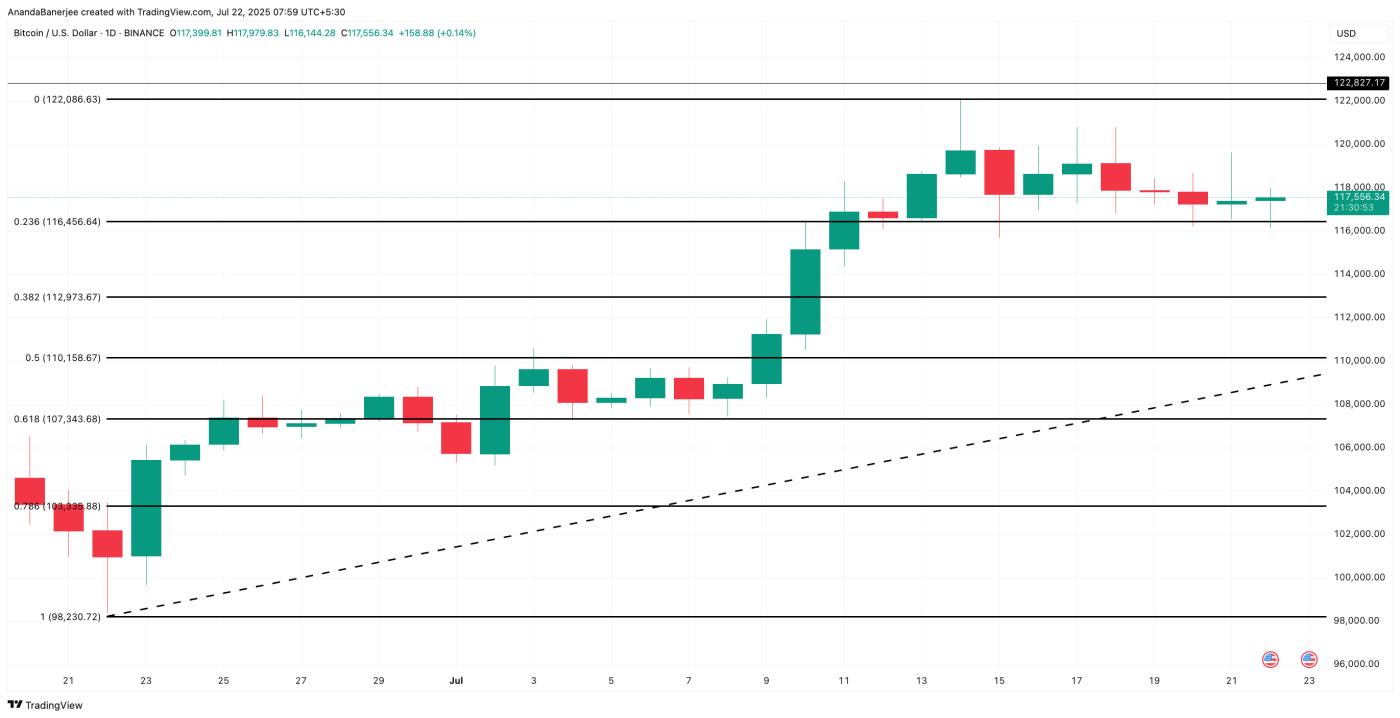 Bitcoin price analysis: TradingView
This zone has become a key battleground; holding above it signals strength, but a confirmed break below would likely open the door to deeper downside.
The strongest support lies at $107,343, which marks the 0.618 Fibonacci level; often considered a golden pocket during retracements. If this level fails to hold, the market could enter a steeper correction phase. Since Bitcoin was in price discovery during the run-up to $122,000, there are limited structural supports below this level.
In such a case, the next viable support rests near $103,355, a 12% correction from current prices. (February 9’s SOPR surge led to a similar correction.)
However, this short-term bearish thesis would be invalidated if the Bitcoin price manages to break above $122,086 and reclaim the previous high near $122,827, while moving higher. A move above this zone, particularly if accompanied by a cooling off in SOPR and a drop in the Whale-to-Exchange Ratio, would point toward renewed bullish momentum.


