The market, project, currency, and other information, opinions, and judgments mentioned in this report are for reference only and do not constitute any investment advice.
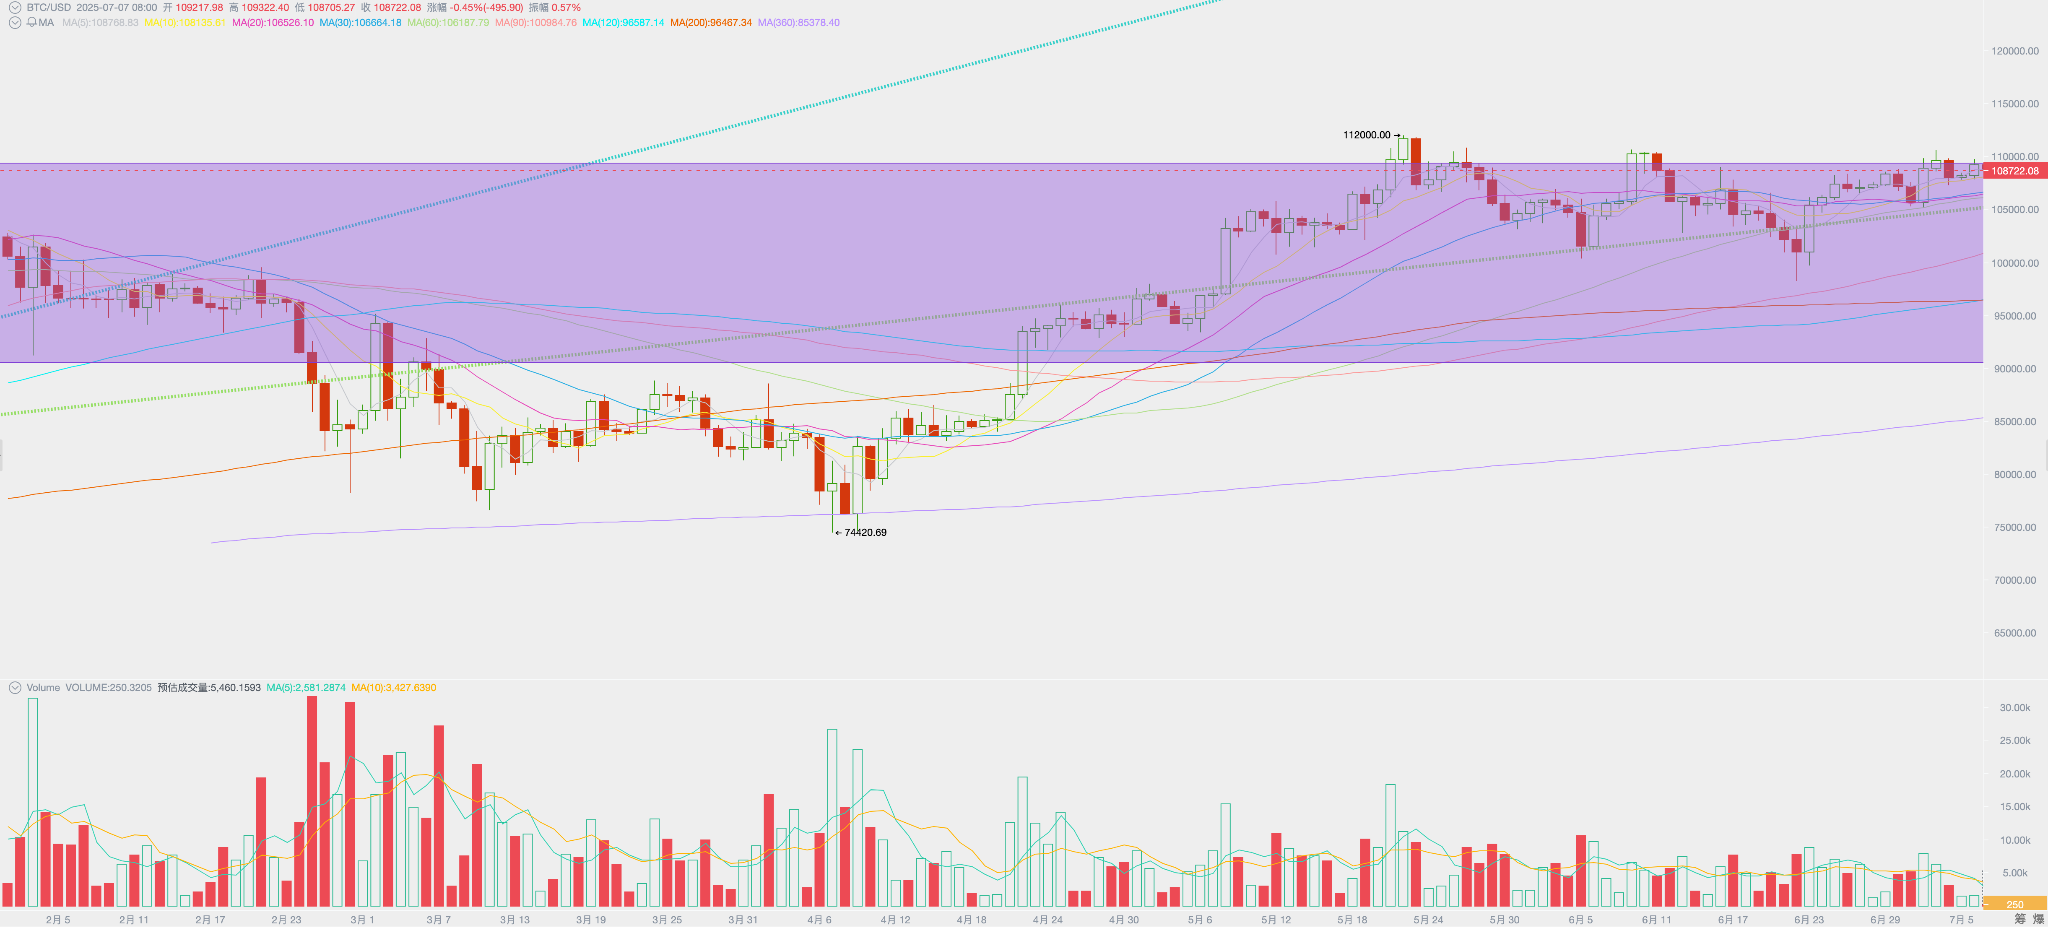
This week, BTC opened at $108,386.44, closed at $109,217.98, rising 0.77%, with a high of $110,590 and a low of $105,119.70, a volatility of 5.05%, and continuing volume contraction.
The past week was relatively bland, with macro events still being the decisive factor for BTC price trends, but neither employment data, the "Big and Beautiful Act", nor the reciprocal tariff war saw changes beyond market expectations.
A prehistoric whale with a position of over 80,000 BTC, silent for more than 14 years, began moving assets this week, creating psychological pressure on the market. As BTC price approaches the historical high again, the trend of long positions reducing might reappear.
Some positive changes are also happening. After being dormant for over a month, the activity of internal funds is starting to increase. This enhancement may resonate with external funds, potentially driving BTC to launch the fourth wave of this bull market.
Policies, Macro Finance, and Economic Data
This week, three macro events intertwined to influence the crypto market.
First, the US employment data exceeded expectations. Data released on July 3rd showed that the US unemployment rate in June was 4.1%, not only significantly lower than the expected 4.3% but also lower than the previous 4.2%. Digging into the data, while private employment positions decreased, state government positions increased significantly. The number of unemployment benefit claims for the week of June 28th was 233,000, also lower than the expected 240,000 and previous value. The latest employment data eliminated market concerns about a US economic recession on one hand, and reduced the probability of a July interest rate cut to 4.7% on the other. Ultimately, the market impact was relatively neutral.
Second, the US President officially signed the "Big and Beautiful Act" on July 4th, achieving the largest political gain of his current term. The act includes large-scale tax cuts, significant government budget increases, and spending reductions. In the long term, this may further lower US dollar credit, increase debt, and reduce government revenue. However, in the medium to short term, it will undoubtedly provide significant economic stimulus. Therefore, despite significant public controversy, the financial market generally interpreted it positively, directly pushing the S&P 500 index to continue creating new historical highs this week.
Third, the "reciprocal tariff war" fully entered its third stage - Trump announced on July 5th that he has signed a "tariff letter" for 12 countries, with a "flat-rate" country-specific tax rate, with the final tax rate range raised to 10% - 70%. The letter will be mailed on July 7th. The tax rate will likely take effect on August 1st, bringing new uncertainties to global trade, inflation, and market sentiment. Because the highest rate significantly exceeded the expected 50%, the market reacted negatively, but the reaction was small due to relatively full pricing.
In our observation framework, the current US economy shows characteristics of a soft landing or no landing, with interest rate cuts expected to start in September. The "Big and Beautiful Act" will have a positive impact on US stocks in the medium to short term, the reciprocal tariff impact is about to pass, so US stocks have again reached new historical highs. In the medium to short term, under the expectation of interest rate cuts, it may maintain an upward trend. However, current US stock valuations are not low, and we need to closely monitor changes in corporate profitability and the impact of tariffs on economic and employment data.
Crypto Market
Compared to the past few weeks, due to the continuity of macro market information, the BTC market was relatively bland this week, but changes are brewing internally.
On July 2nd, BTC again verified the "first bull market upward trend line", but spent most of the week around $108,000, making the third attempt to break the 8-month-old historical high of $110,000.
The BTC retail market shows clear differentiation, with internal fund trading enthusiasm waning and on-chain activity and new addresses performing averagely. However, the BTC Spot ETF market is thriving, recording continuous fund inflows.
Currently, BTC price and trend are entirely controlled by BTC Spot ETF channel funds, with BTC trend correlation with Nasdaq rising to 0.94.
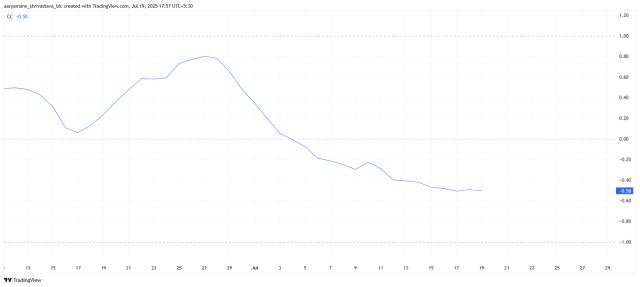
Some changes might be happening. After falling to low levels, lending rates are starting to rebound, and the 30-day average premium rate in the futures market is also rebounding after hitting low levels. Of course, the sustainability of both needs observation. In the June monthly report, we predicted the market would reach a new level in the third quarter. If BTC Spot ETF channel funds continue to flow in and internal funds start to long in resonance, the fourth wave of increase might be realized soon.
Fund Inflows and Outflows
After the big rebound in April and May, fund inflows have become differentiated, with stablecoin channel funds weakening and BTC Spot ETF channel funds remaining relatively robust and stable.
This week, BTC Spot ETF channel funds flowed in $790 million, noticeably weaker than last week but still maintaining a high level.
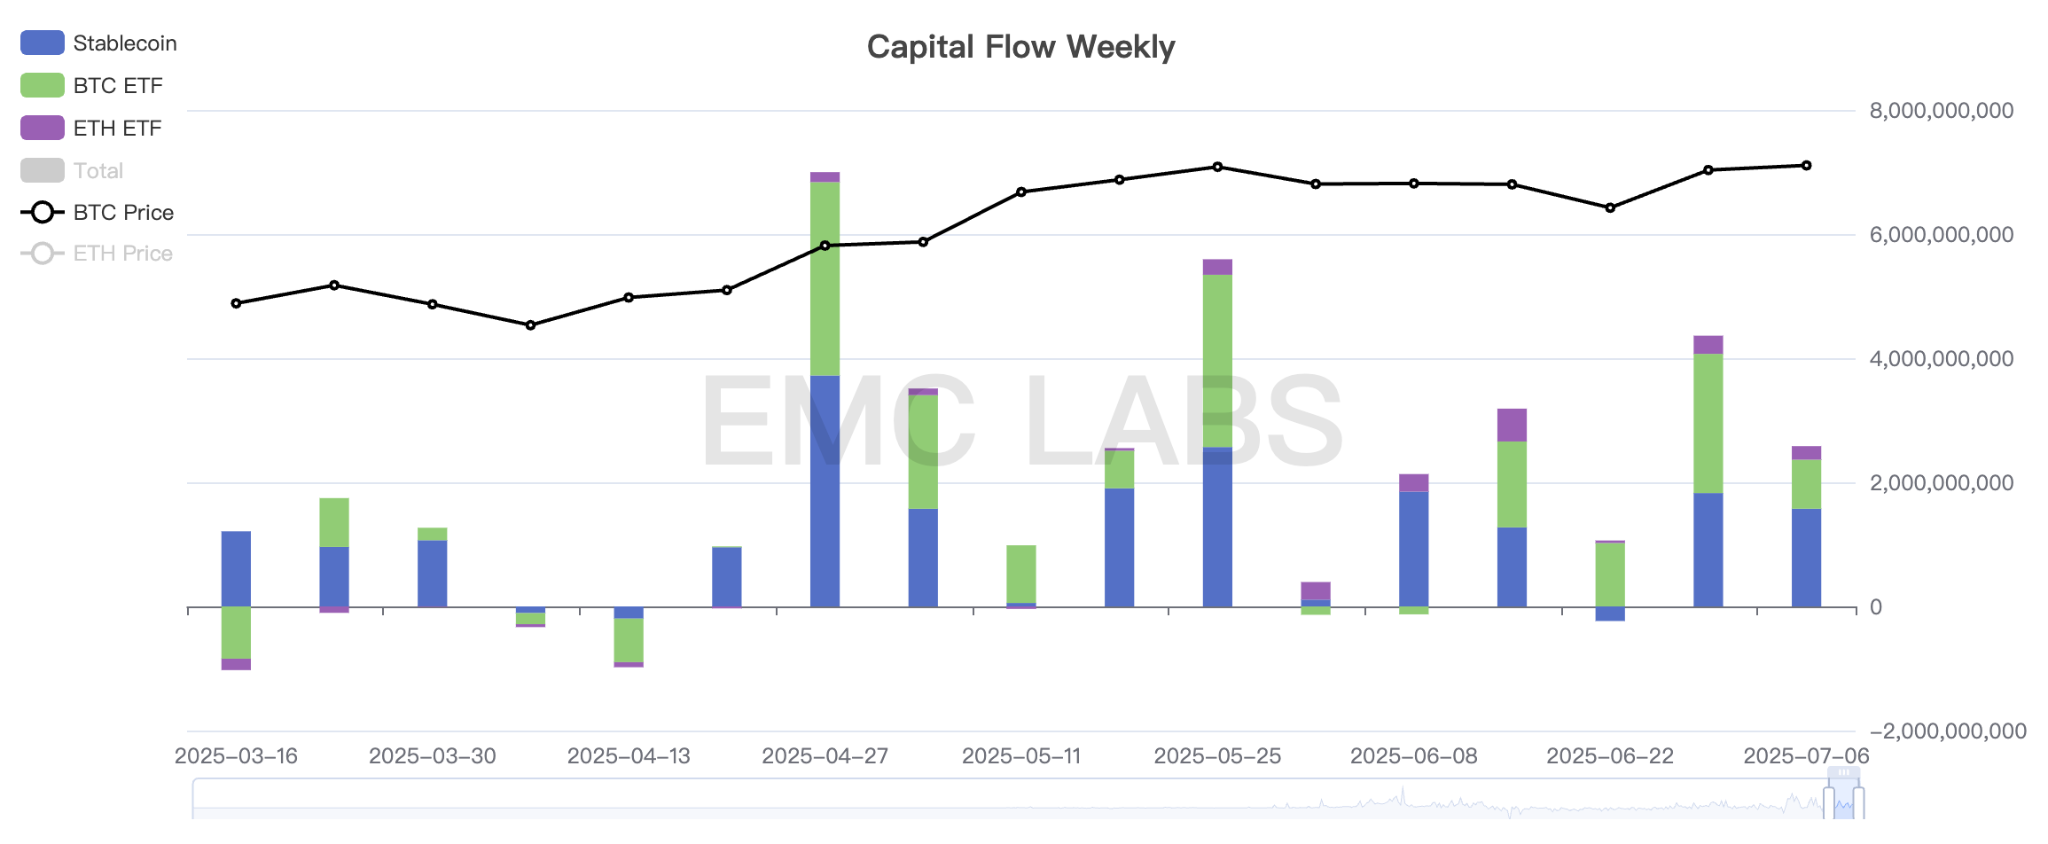
Crypto Market Fund Entry Statistics (Weekly)
Stablecoin channel inflow was $1.574 billion, close to last week.
Selling Pressure and Sales
As the price again challenges $110,000, long positions seem to be starting to reduce again.
From the scale of transfers to exchanges, the total sales volume of long and short positions continues to shrink this week, providing strong support for BTC price increases.
However, this week, an ancient wallet with over 80,000 BTC experienced unusual activity. The significant movement of this wallet, which had been silent for 14 years, caused on-chain realized value to rise sharply.
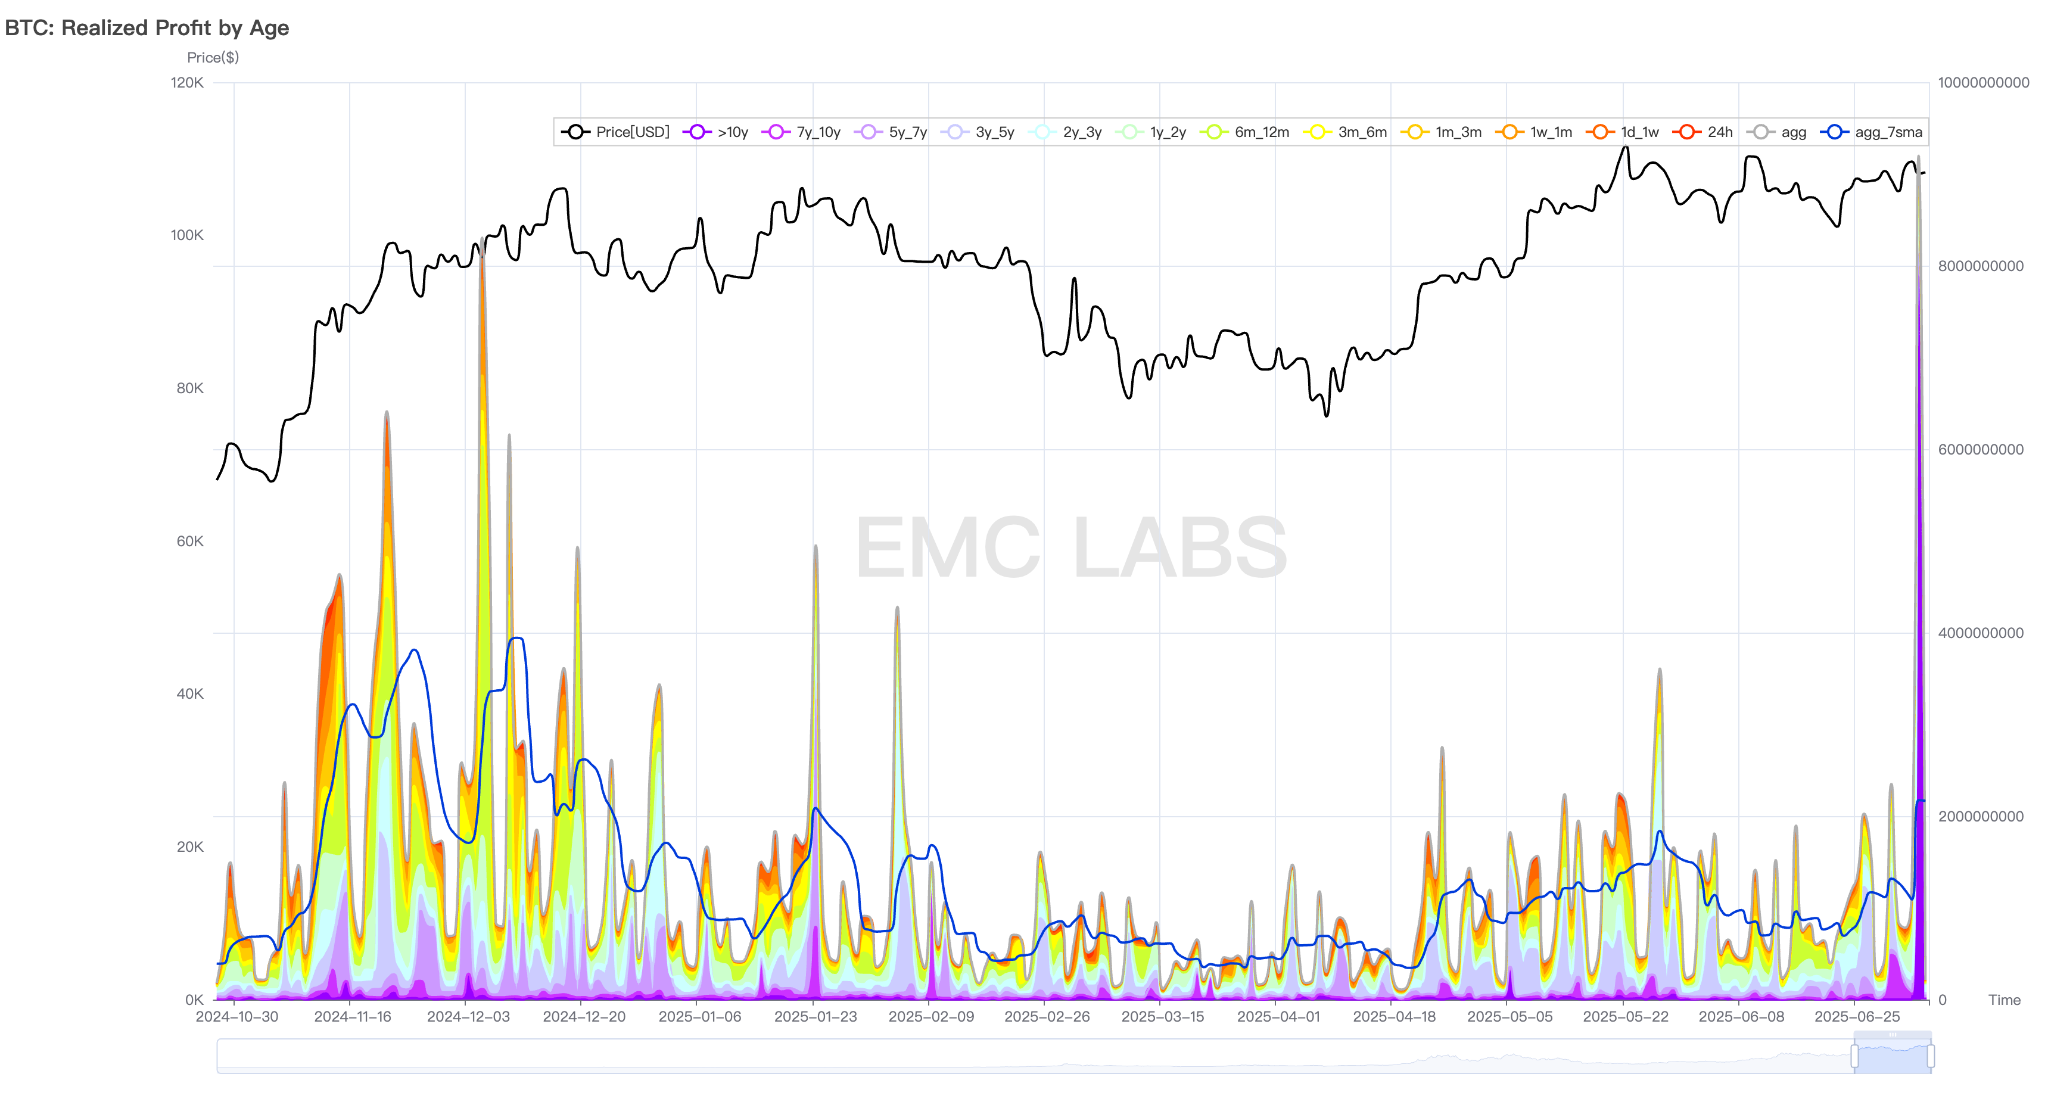
On-chain Value Realization Statistics
Based on the current trend, once BTC breaks through $110,000 and launches the fourth wave of increase, sales by long positions and high-age BTC will likely restart. These sales will discover BTC's new price with buying power and determine its height.
Cycle Indicators
According to eMerge Engine, the EMC BTC Cycle Metrics indicator is 0.625, in an upward period.

EMC Labs was established in April 2023 by crypto asset investors and data scientists. Focusing on blockchain industry research and crypto secondary market investment, with industrial foresight, insights, and data mining as core competencies, committed to participating in the booming blockchain industry through research and investment, and promoting blockchain and crypto assets to bring benefits to humanity.
For more information, please visit: https://www.emc.fund